Despite the steady decline in price, the Natural Gas chart is giving signals about a possible completion of the current bearish momentum.
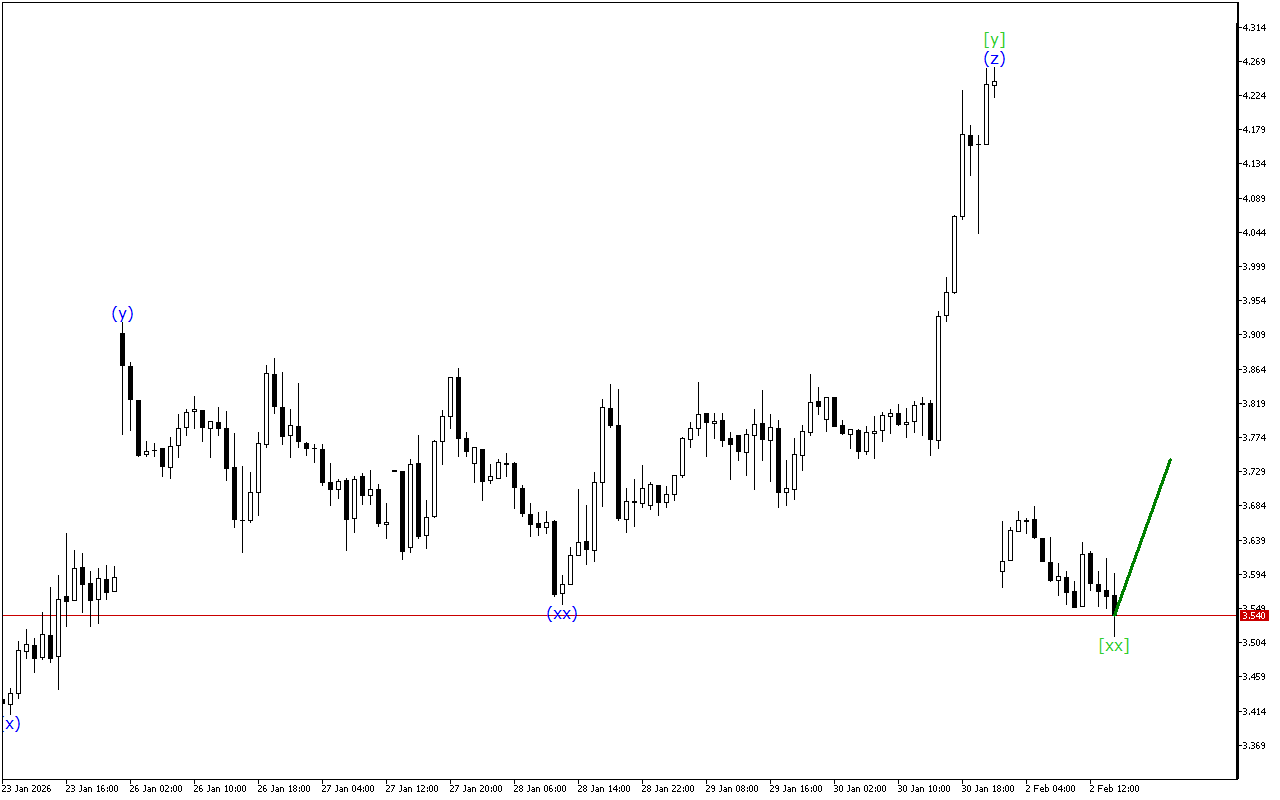
The medium-term movement vector of Natural Gas indicates the formation of a Triple Three wave structure. Now the formation of the wave [xx] is completed and the beginning of an upward movement within the wave [z] is expected.
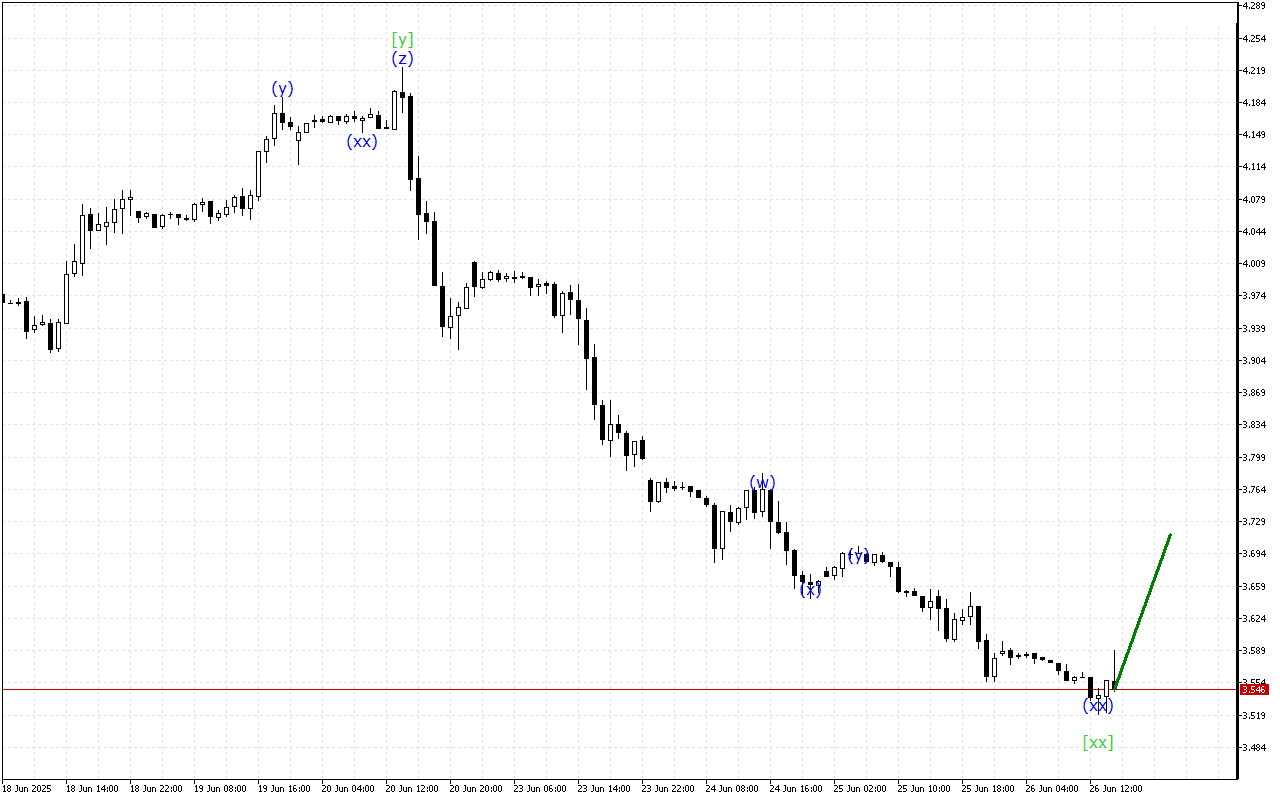
At a lower-degree wave structure, the formation of a triple three is noted. Now the price is in the wave (z), which completes this formation. This wave is expected to end in the near future. After that the current price trend may change.
To summarize, at the moment the Natural Gas chart is maintaining a downward movement vector. However, the corrective wave is in the final stage of formation.
In this situation, long positions are prioritized.
Alternative scenario
Short positions will be relevant after the breakout of the current wave start level
Natural Gas H1: Wave Analysis for the American Session on 2.2.2026