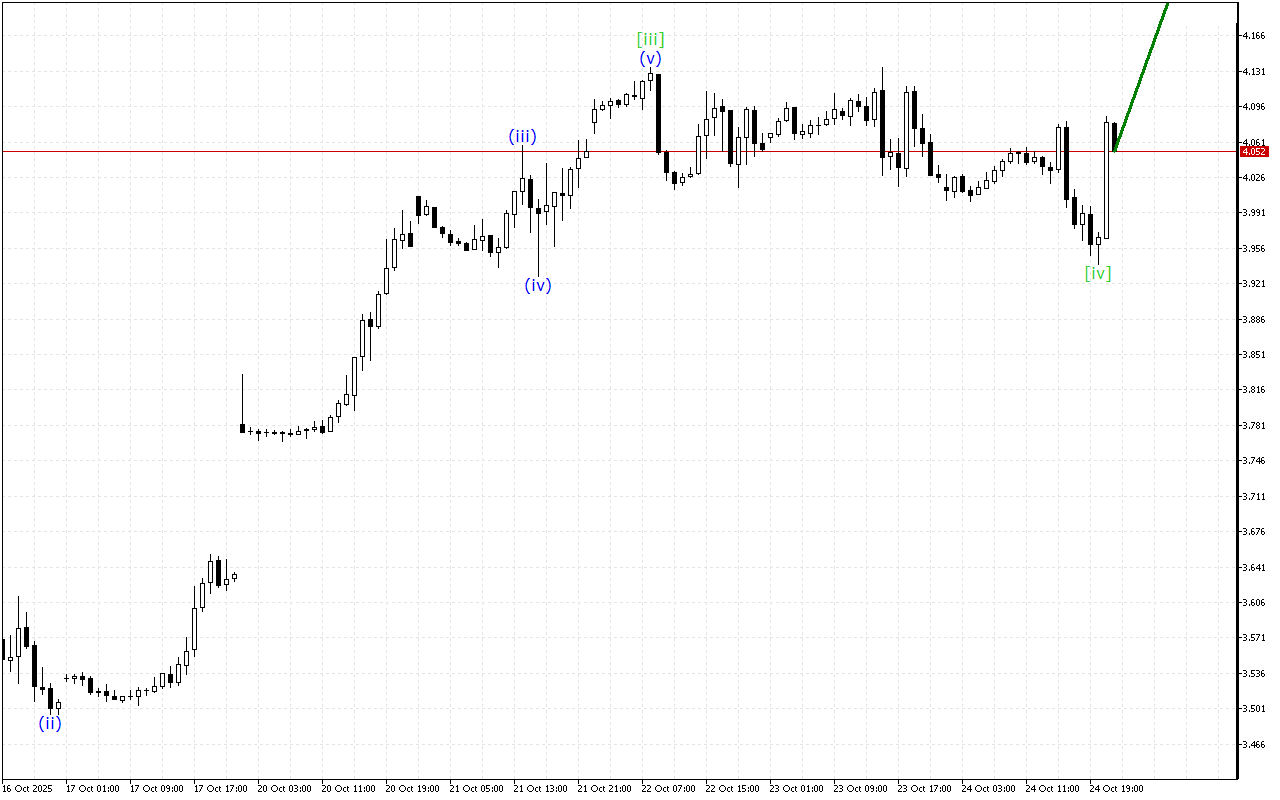
Despite the decline, there are signals on the Natural Gas chart indicating a possible upcoming change in direction.
At a higher interval, a correctional wave [iv] continues to form. After its completion, the market will again move upward. As part of this movement, the formation of wave [v] with an update of the local maximum should be seen.
The analysis of the wave structure on the lower time interval indicates the development of an upward impulse. The price forms the last wave (v). After its completion, the market may move into a correction.
Despite the current downward movement on the Natural Gas chart, the situation may change soon. The corrective wave is close to completion, which may indicate the possibility of a price reversal.
In the current situation, it is worth paying more attention to long positions.
Natural Gas H1: Wave Analysis for the Asian Session on 27.10.2025