The price continues to move down, but the USDCHF chart shows signs that the downward momentum is likely to end soon.
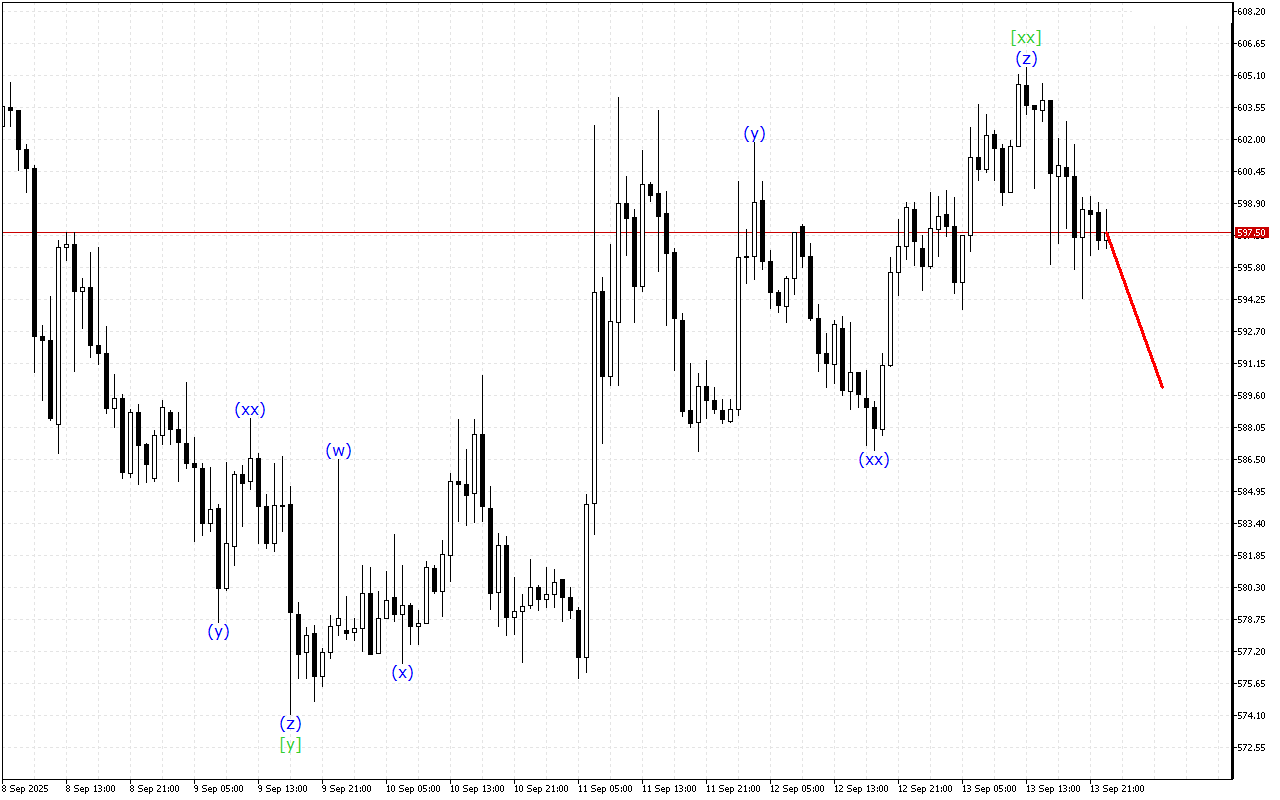
The medium-term movement vector of USDCHF indicates the formation of a Triple Three wave structure. Now the formation of the wave [xx] is completed and the beginning of an upward movement within the wave [z] is expected.
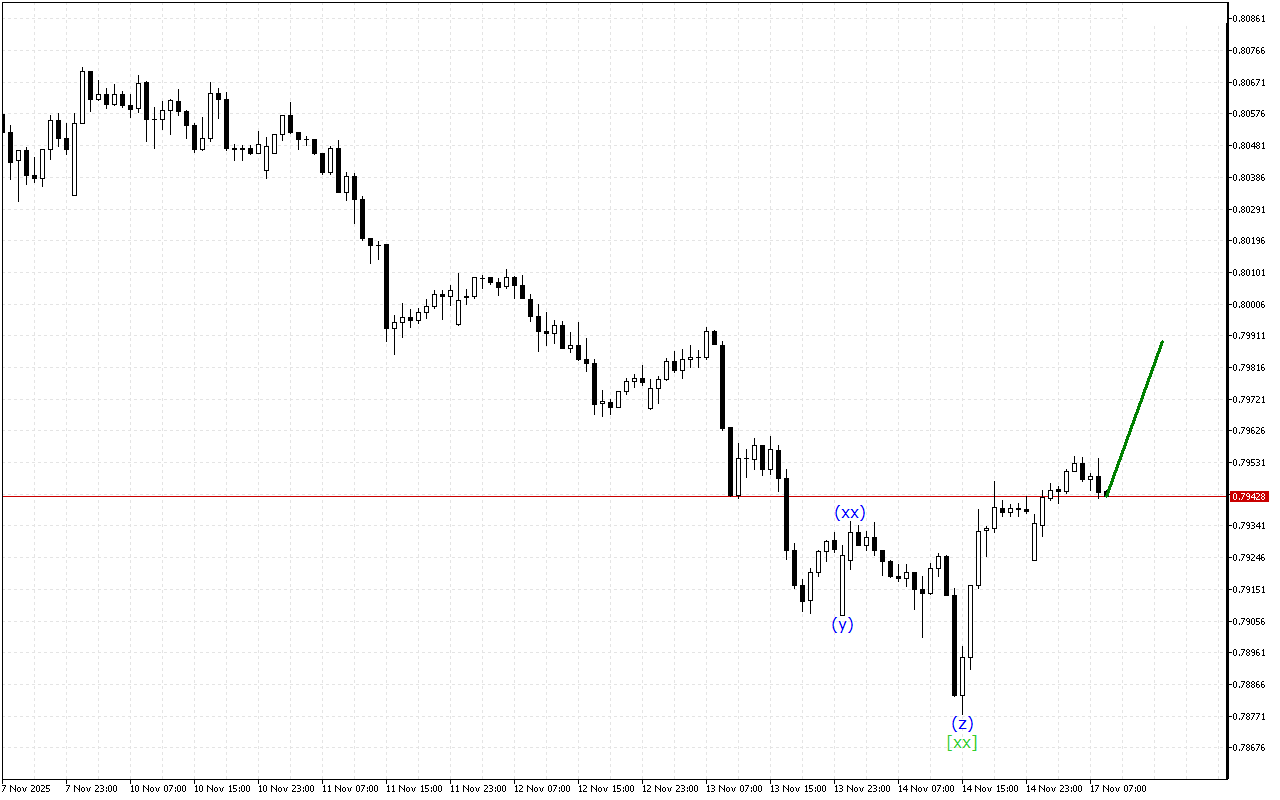
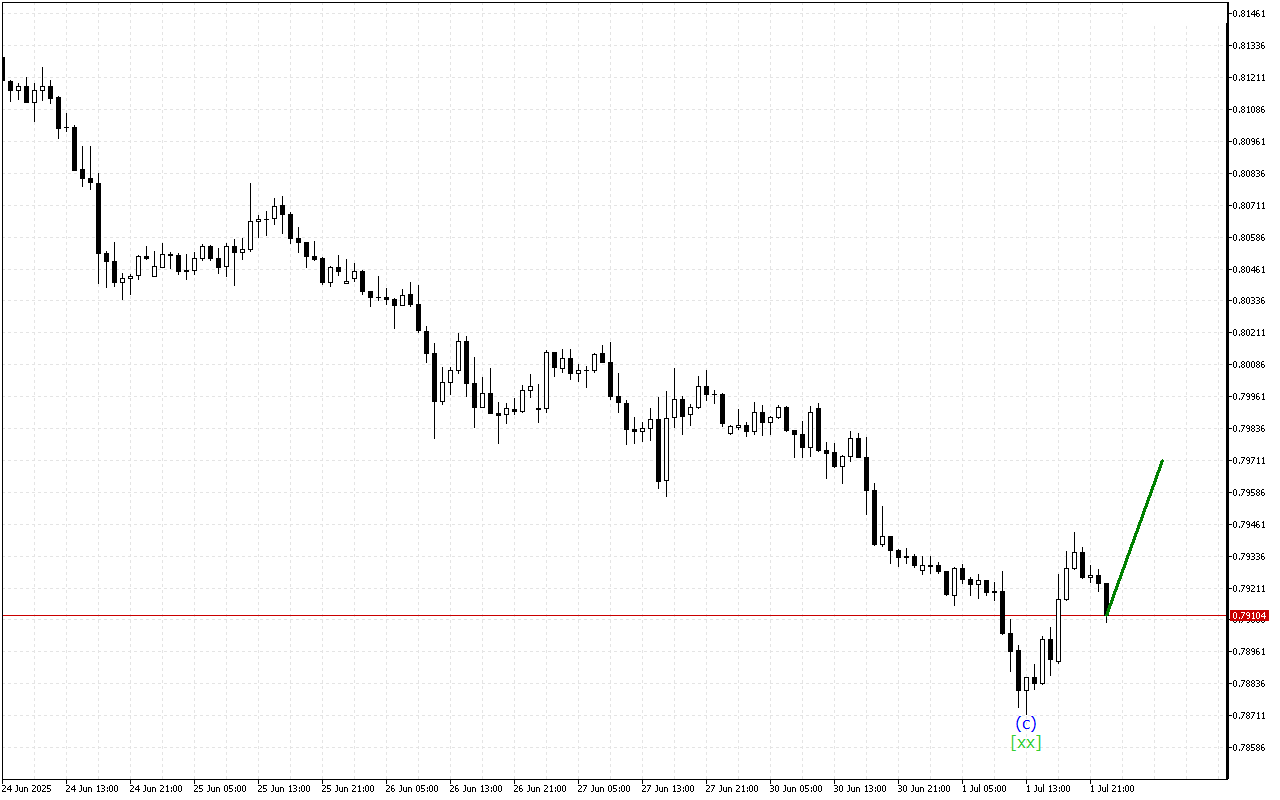
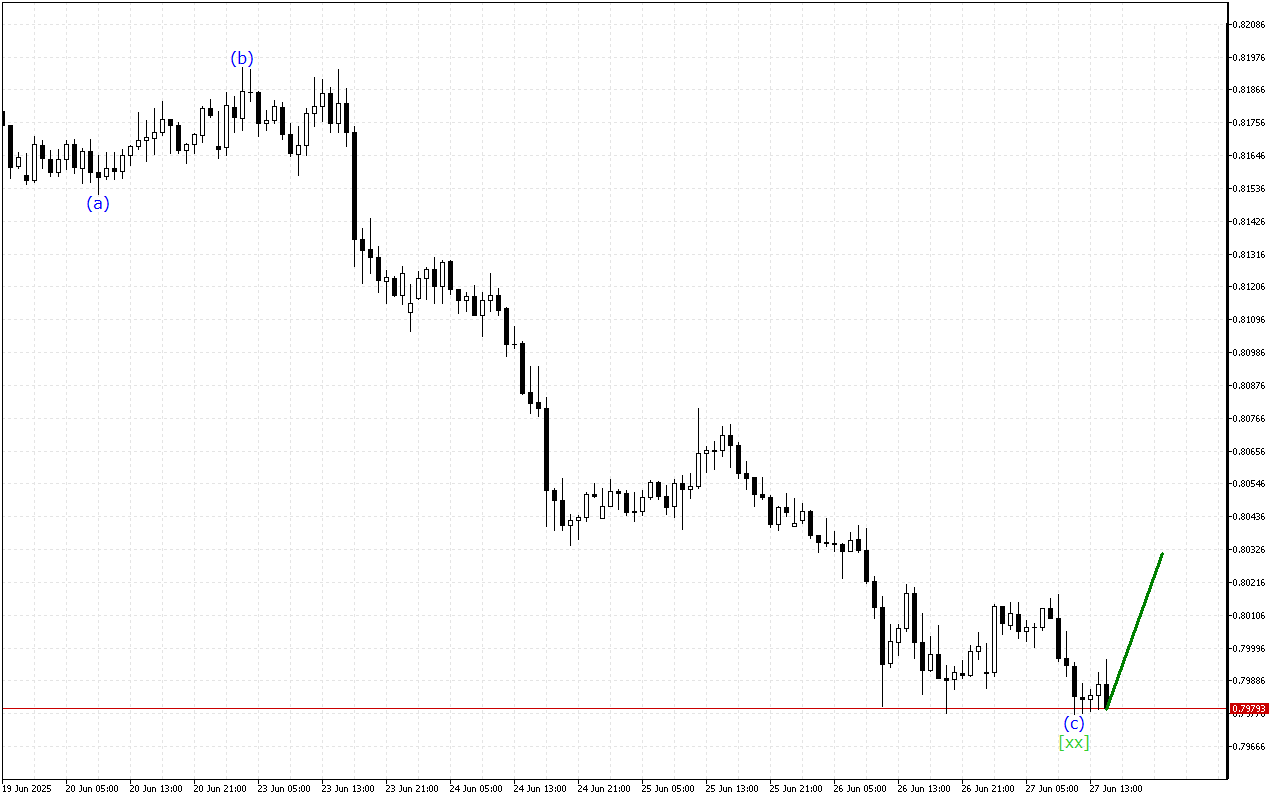
Waves of a lower time-frame form a triple three. The price is currently in the wave (z). When this wave is completed, a more directional price movement is expected.
To summarize, at the moment the USDCHF chart is maintaining a downward movement vector. However, the corrective wave is in the final stage of formation.
In this situation, long positions are prioritized.
USDCHF H1: Wave Analysis for the European Session on 17.11.2025