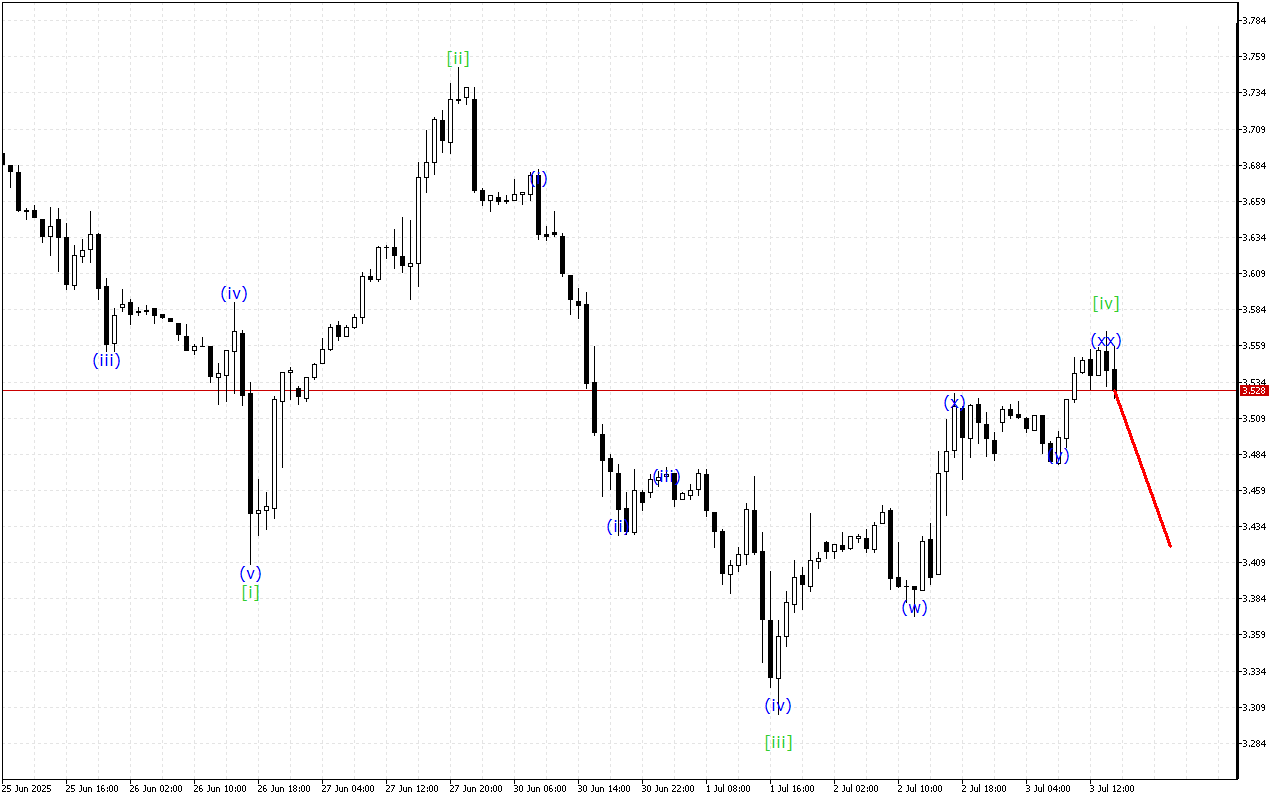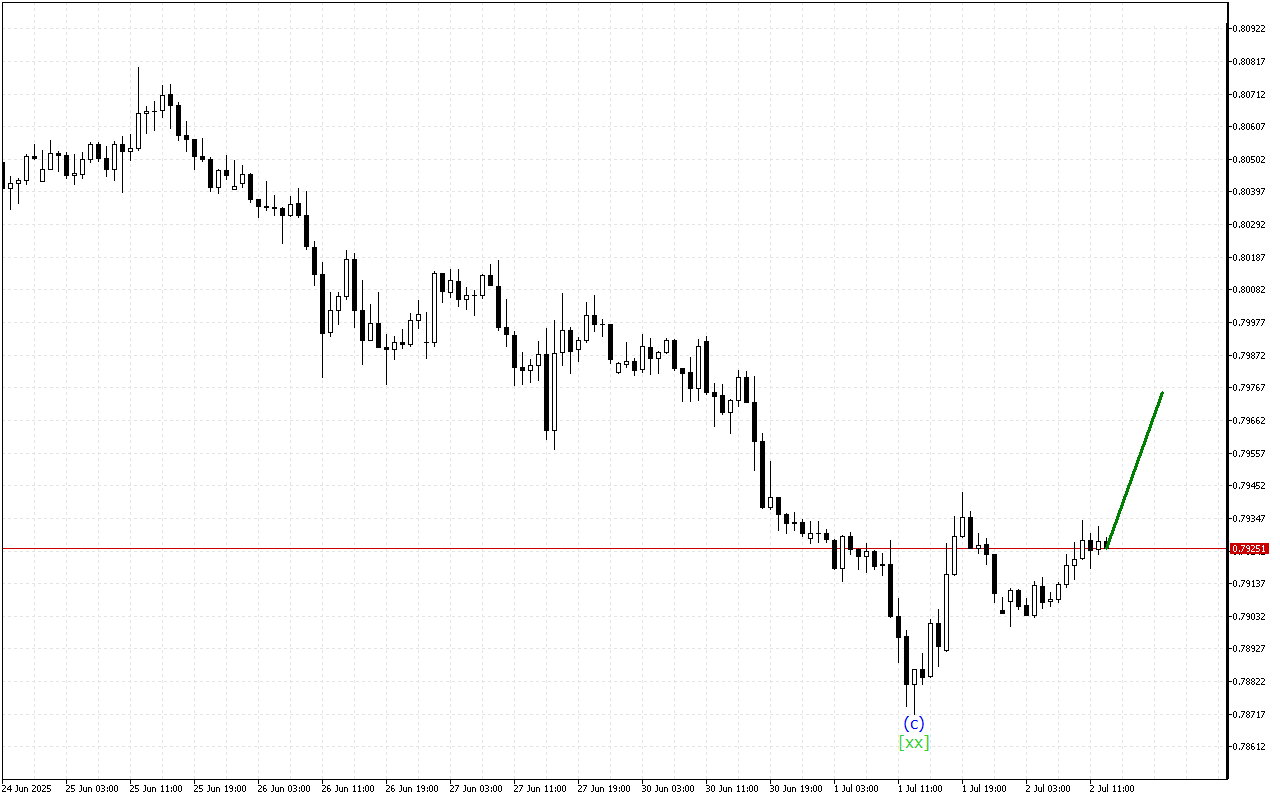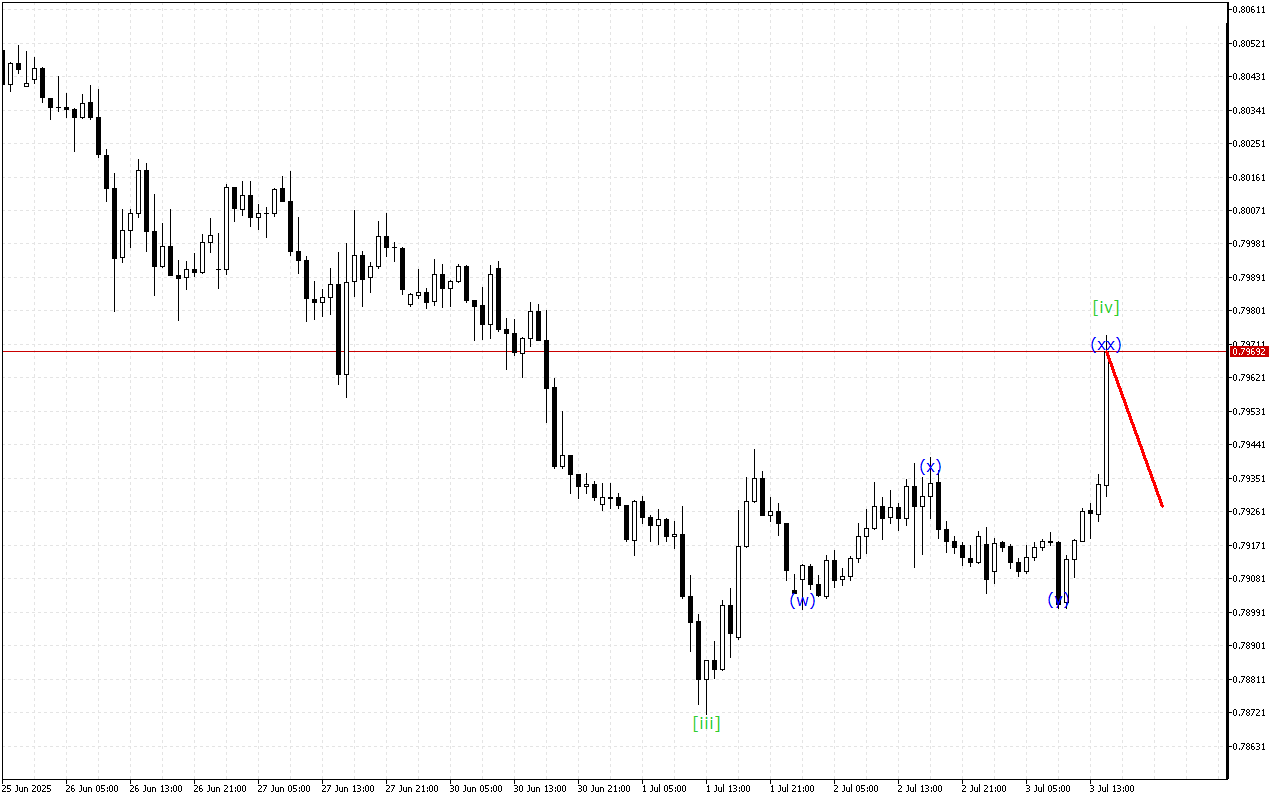
USDCHF H1: Wave Analysis for the American Session on 3.7.2025
Although the market maintains an upward momentum prevalence, the USDCHF chart shows signs of a possible end to this trend.The…
Although the market maintains an upward momentum prevalence, the USDCHF chart shows signs of a possible end to this trend.The…
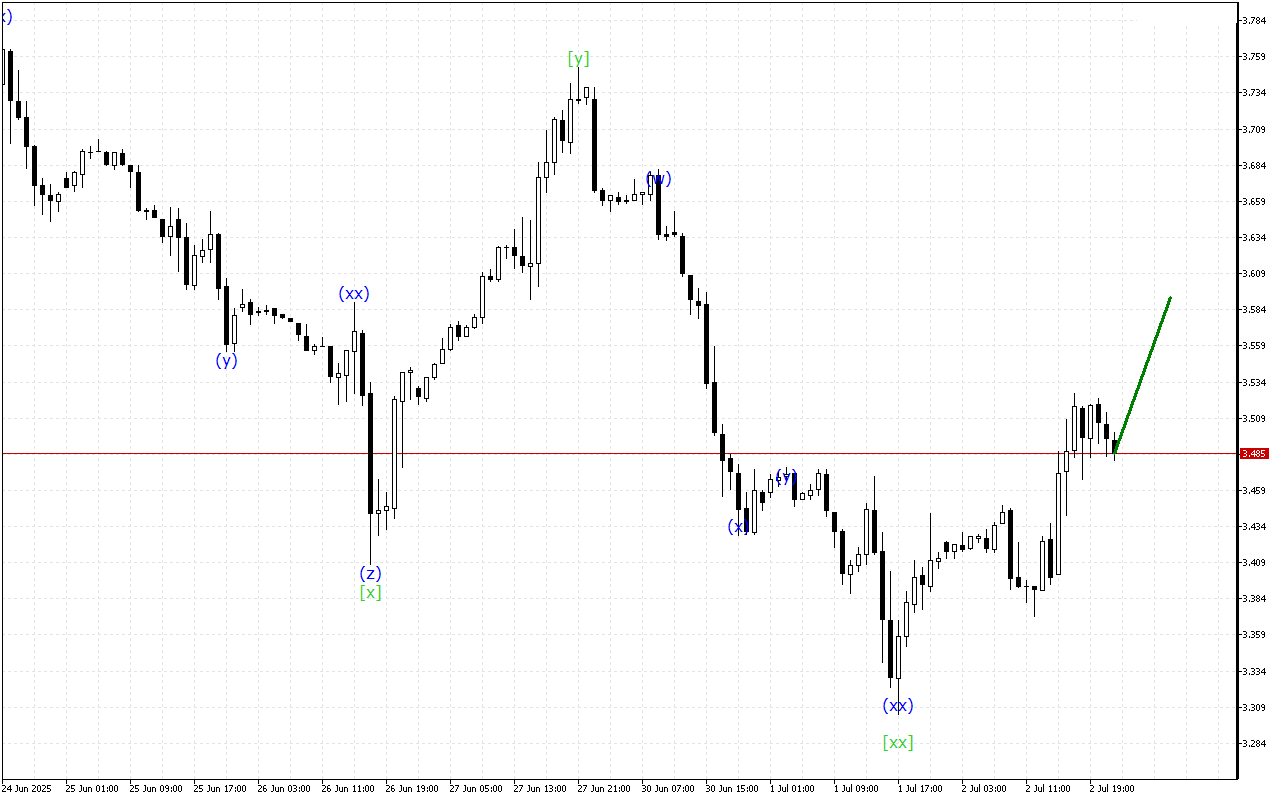
The Natural Gas chart shows signals for the end of the upward movement phase.The analysis of the higher degree wave…
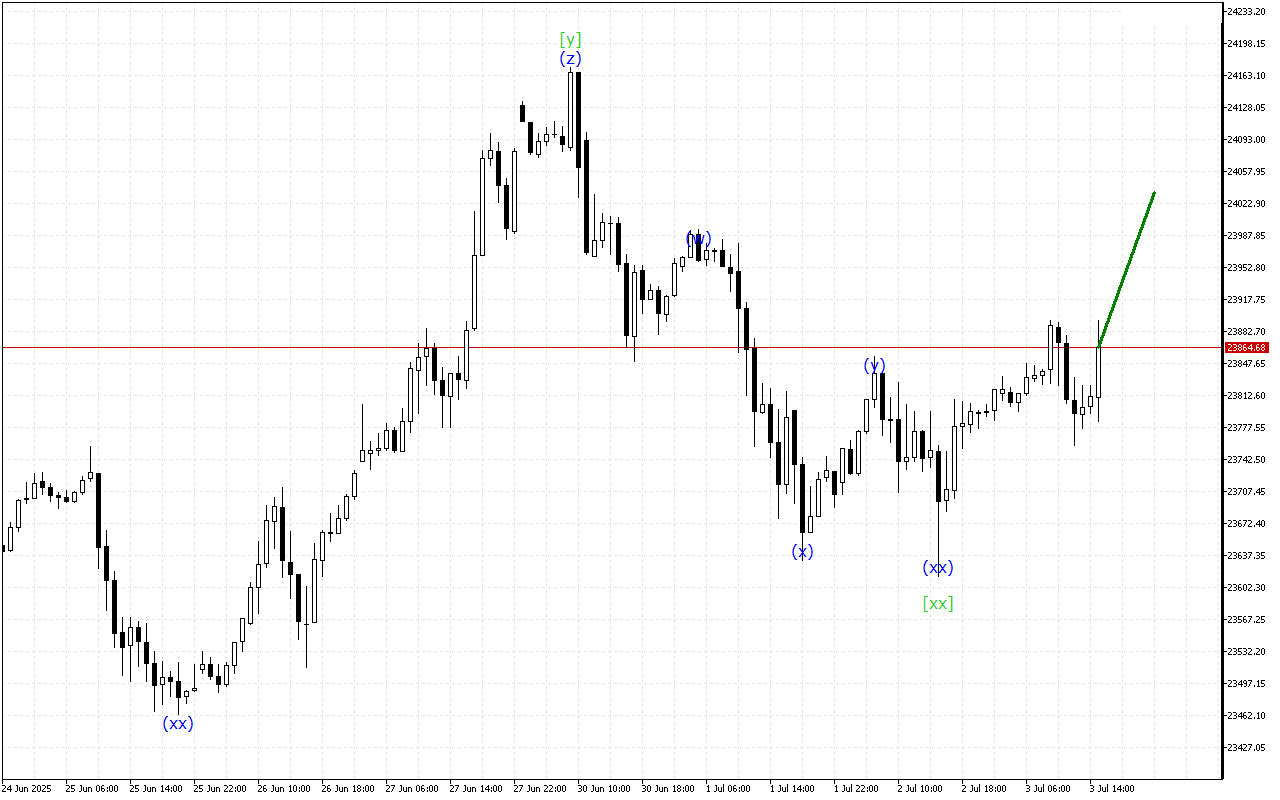
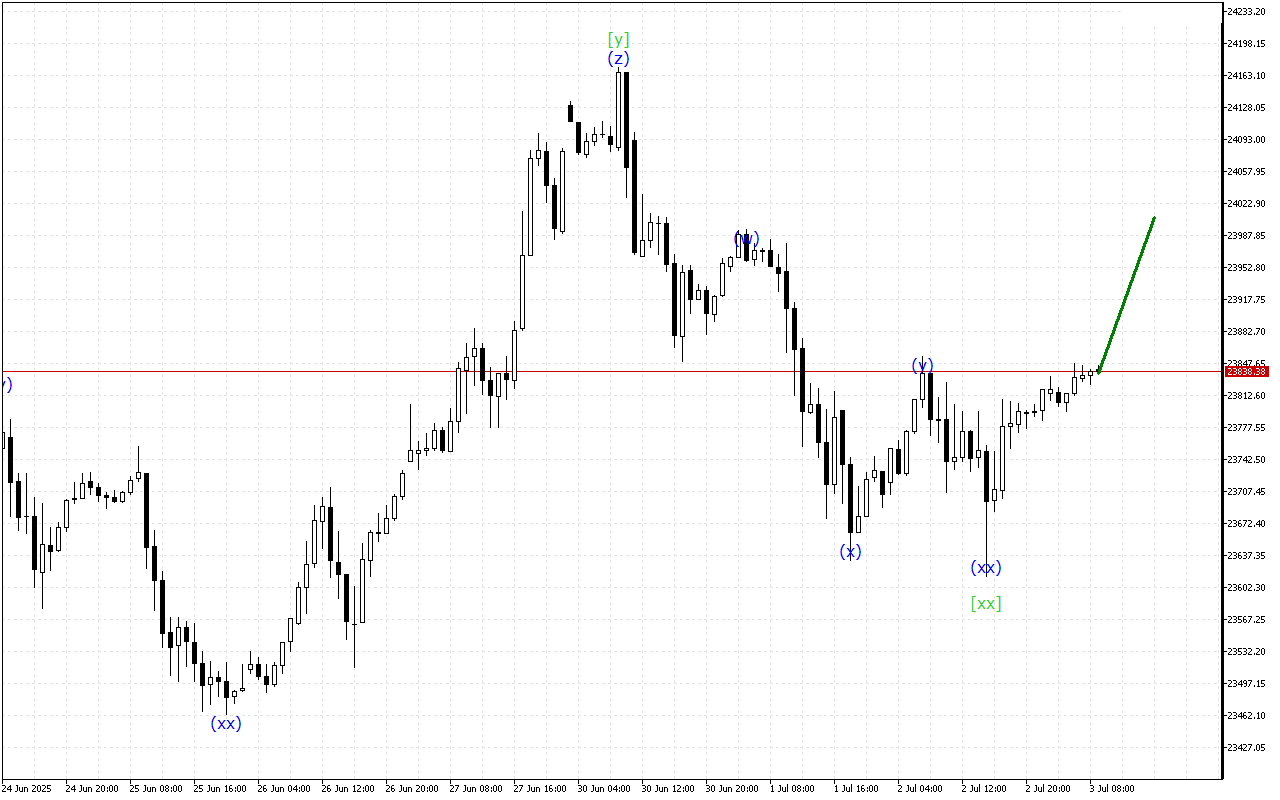
The price continues to move down, but the DAX 40 chart shows signs that the downward momentum is likely to…
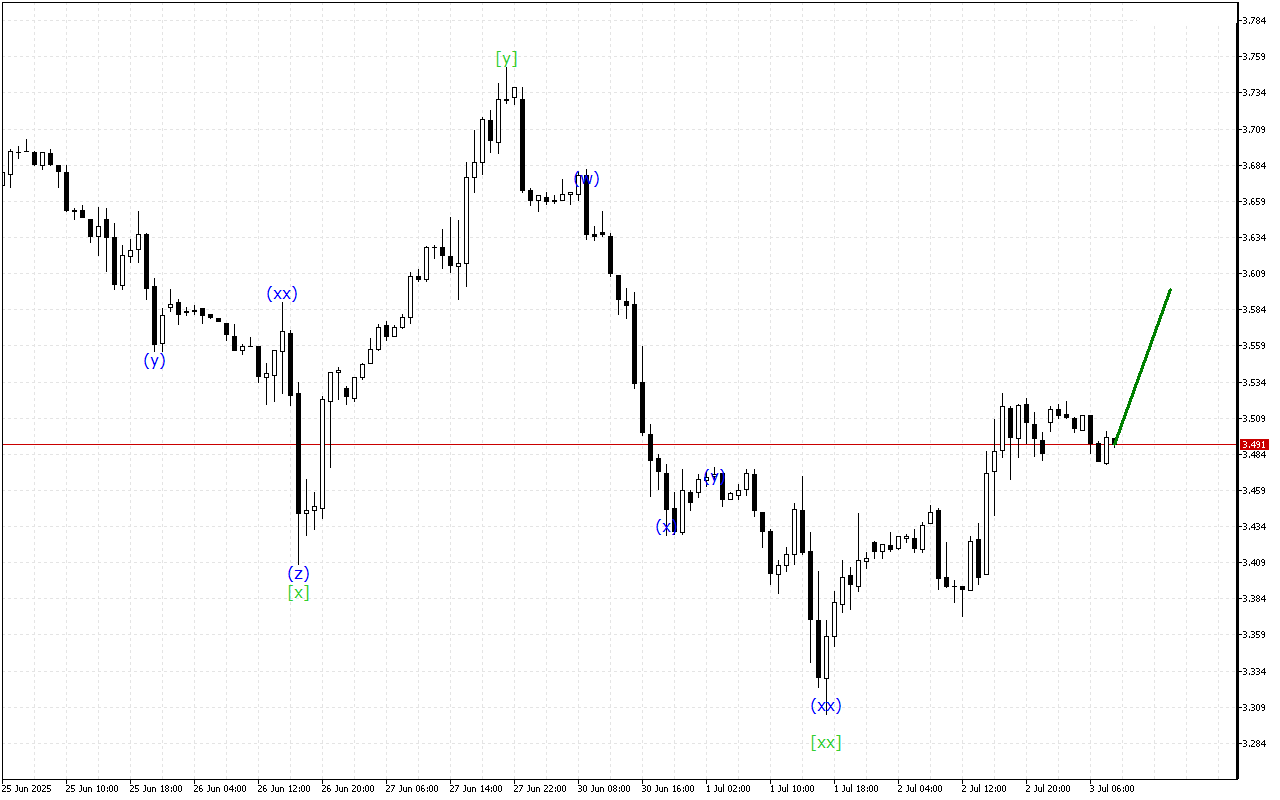
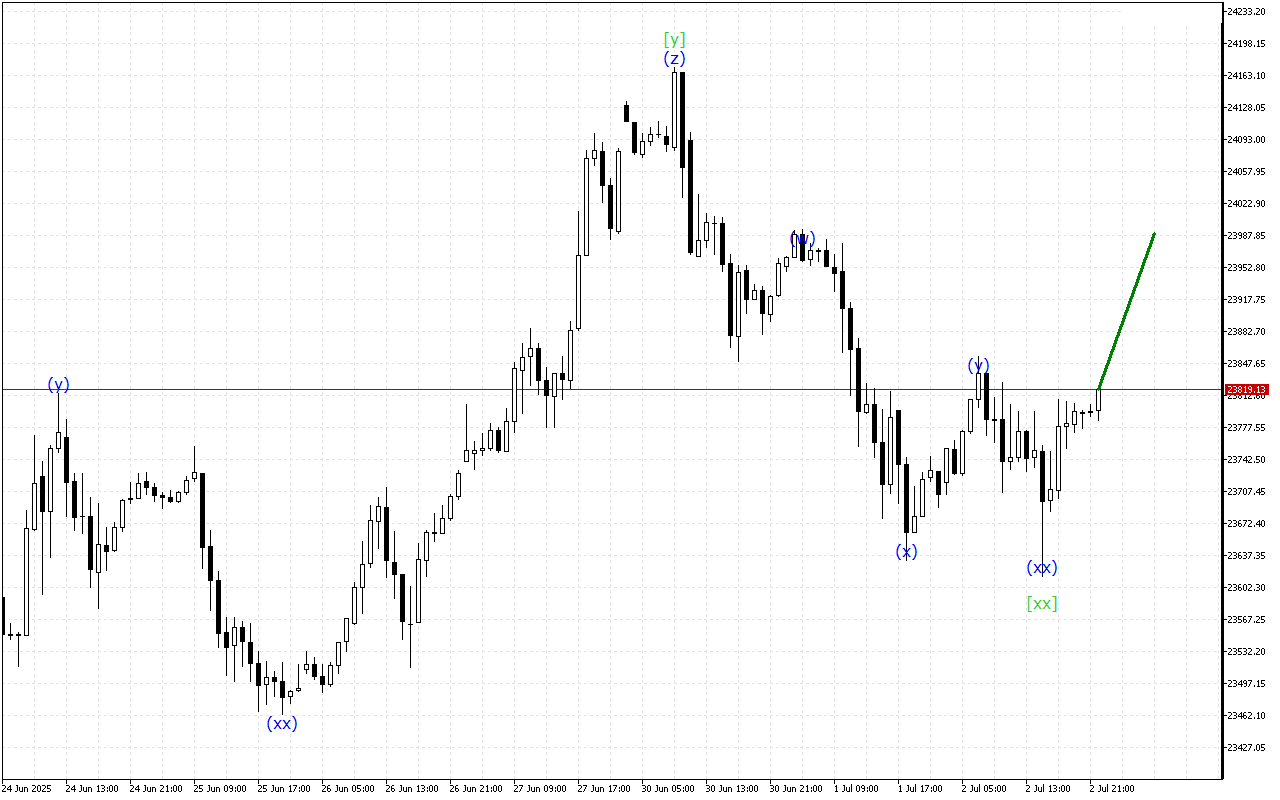
The market remains in a downtrend, though wave analysis indicates a potential end to the current trend.The medium-term movement vector…
The market is still heading down, but the chart shows signs that the current trend will end soon.The medium-term movement…
The price continues to move down, but the DAX 40 chart shows signs that the downward momentum is likely to…
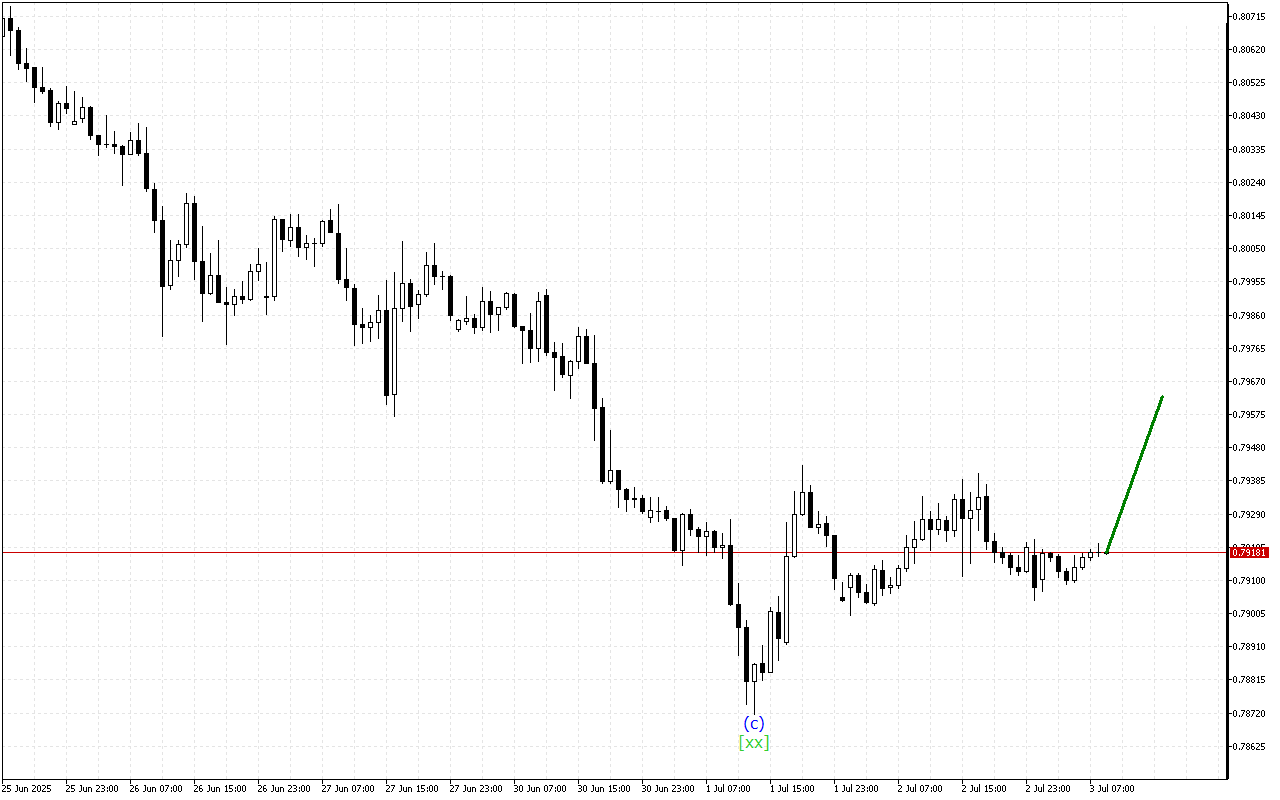
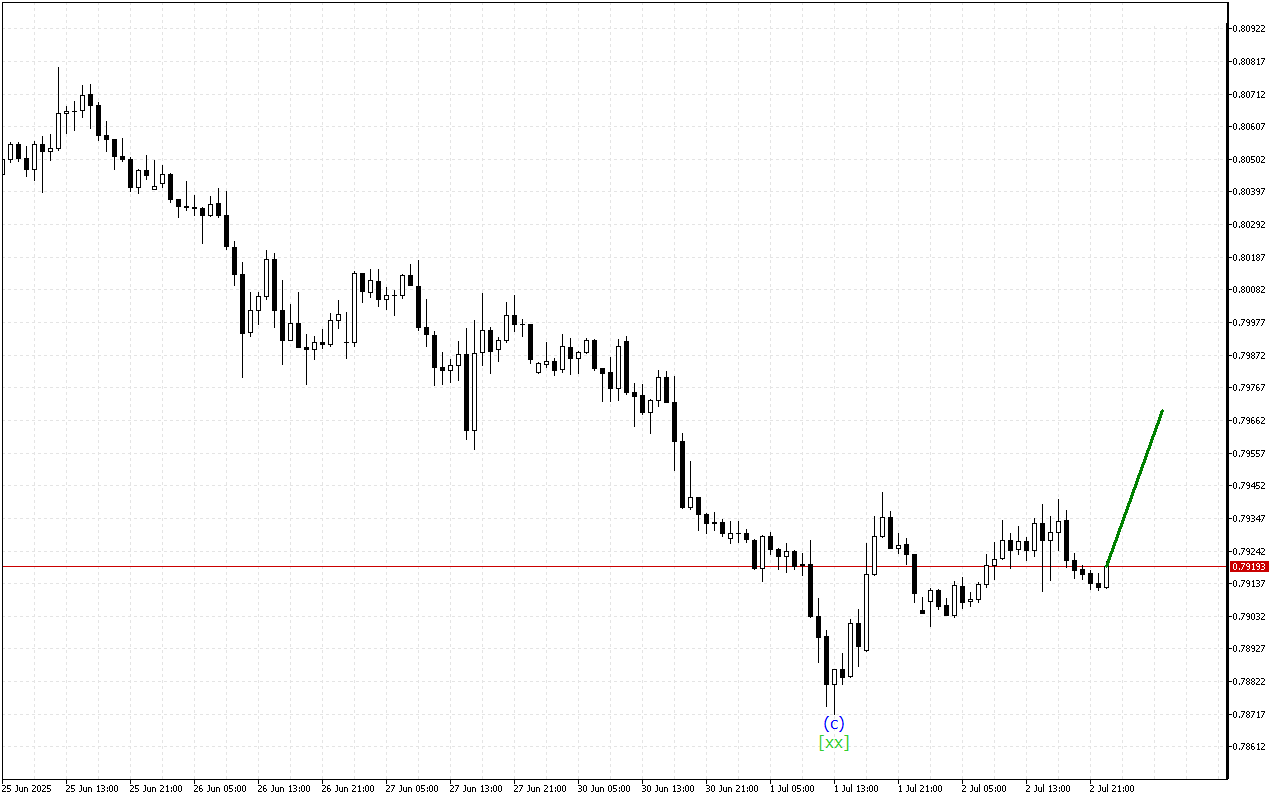
Despite the steady decline in price, the USDCHF chart is giving signals about a possible completion of the current bearish…
The market remains in a downtrend, though wave analysis indicates a potential end to the current trend.The medium-term movement vector…
The market remains in a downtrend, though wave analysis indicates a potential end to the current trend.The medium-term movement vector…
The market remains in a downtrend, though wave analysis indicates a potential end to the current trend.USDCHF continues to move…