Natural Gas H1: Wave Analysis for the European Session on 14.5.2025
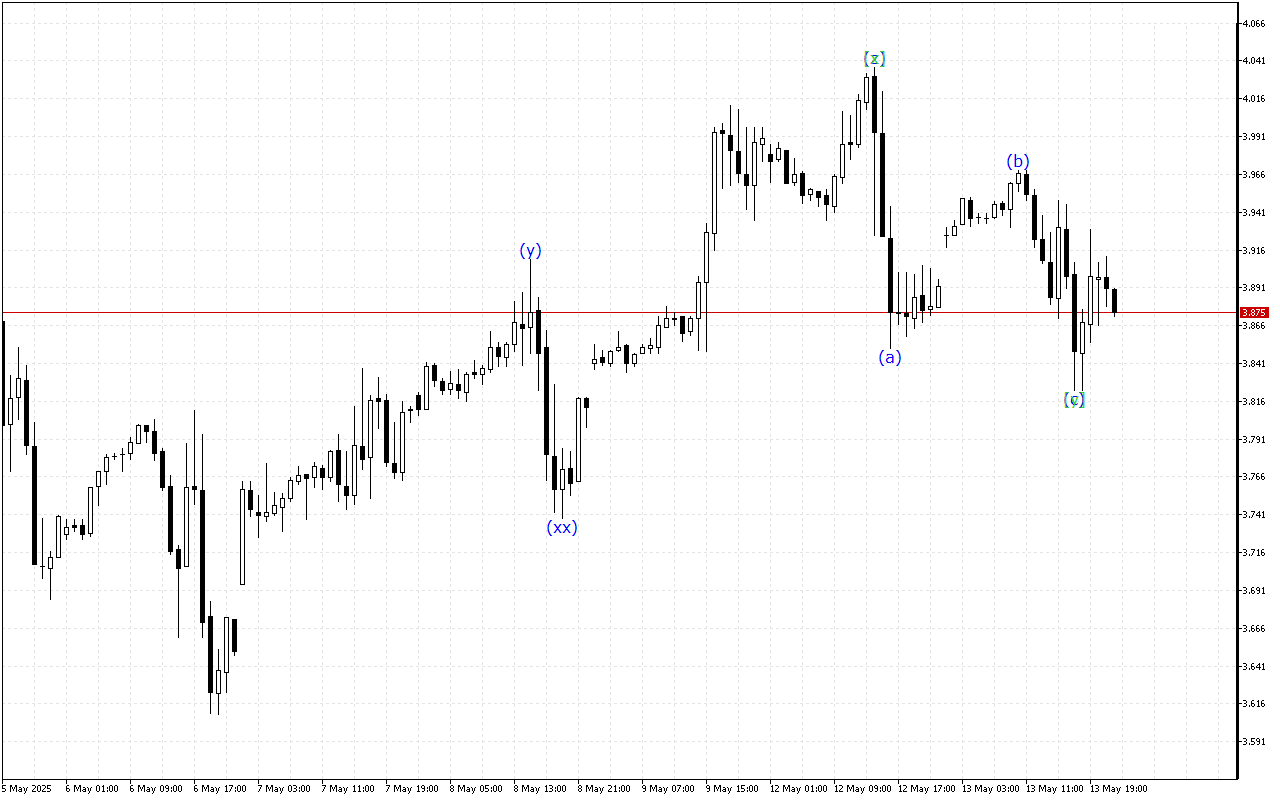
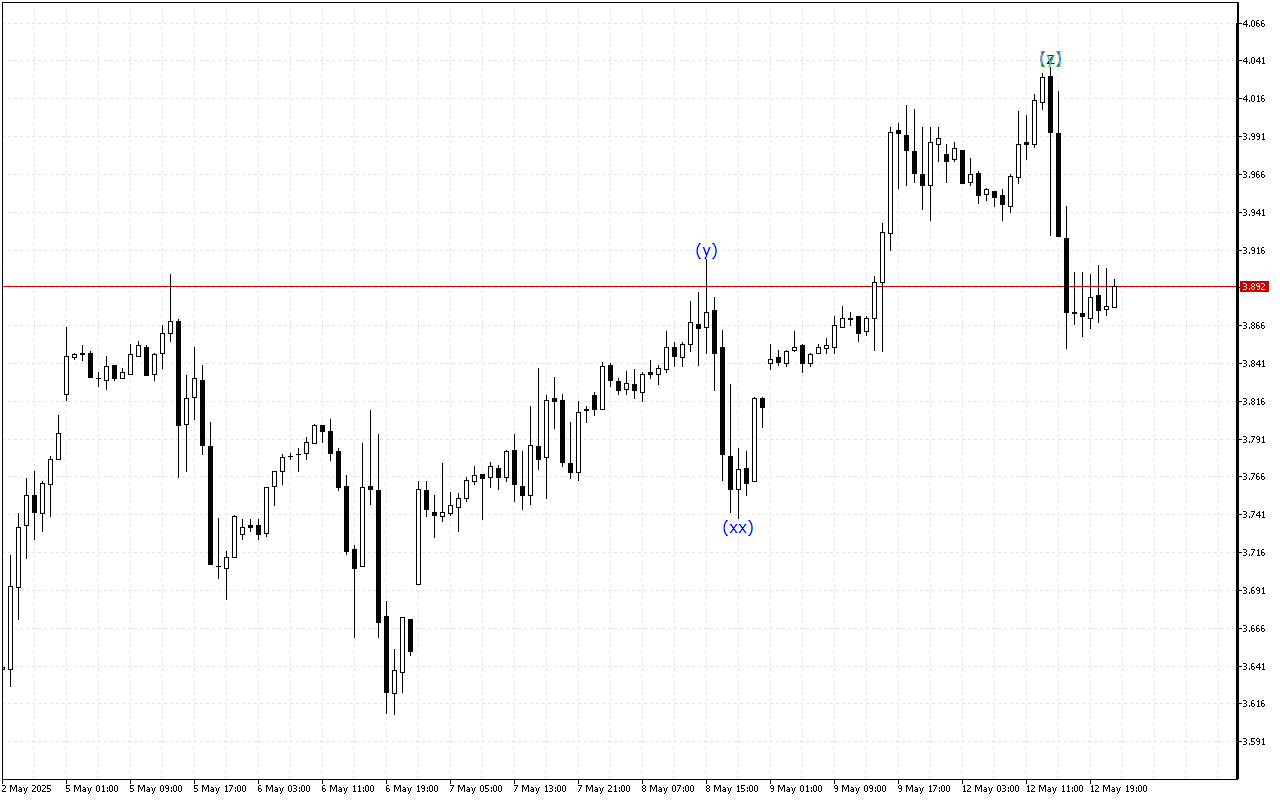
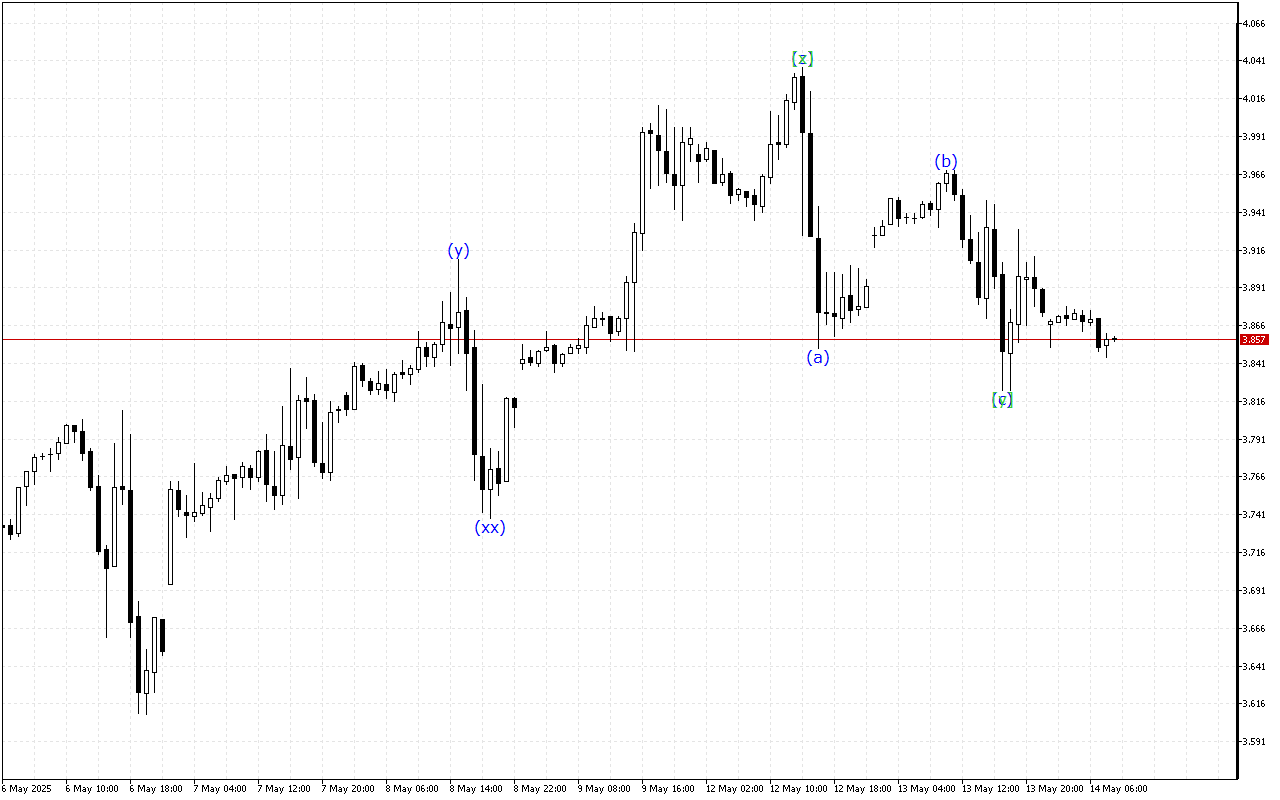
The Natural Gas chart shows mixed trading dynamics, with periods of both positive and negative price activity.The current wave structure…
The Natural Gas chart shows mixed trading dynamics, with periods of both positive and negative price activity.The current wave structure…
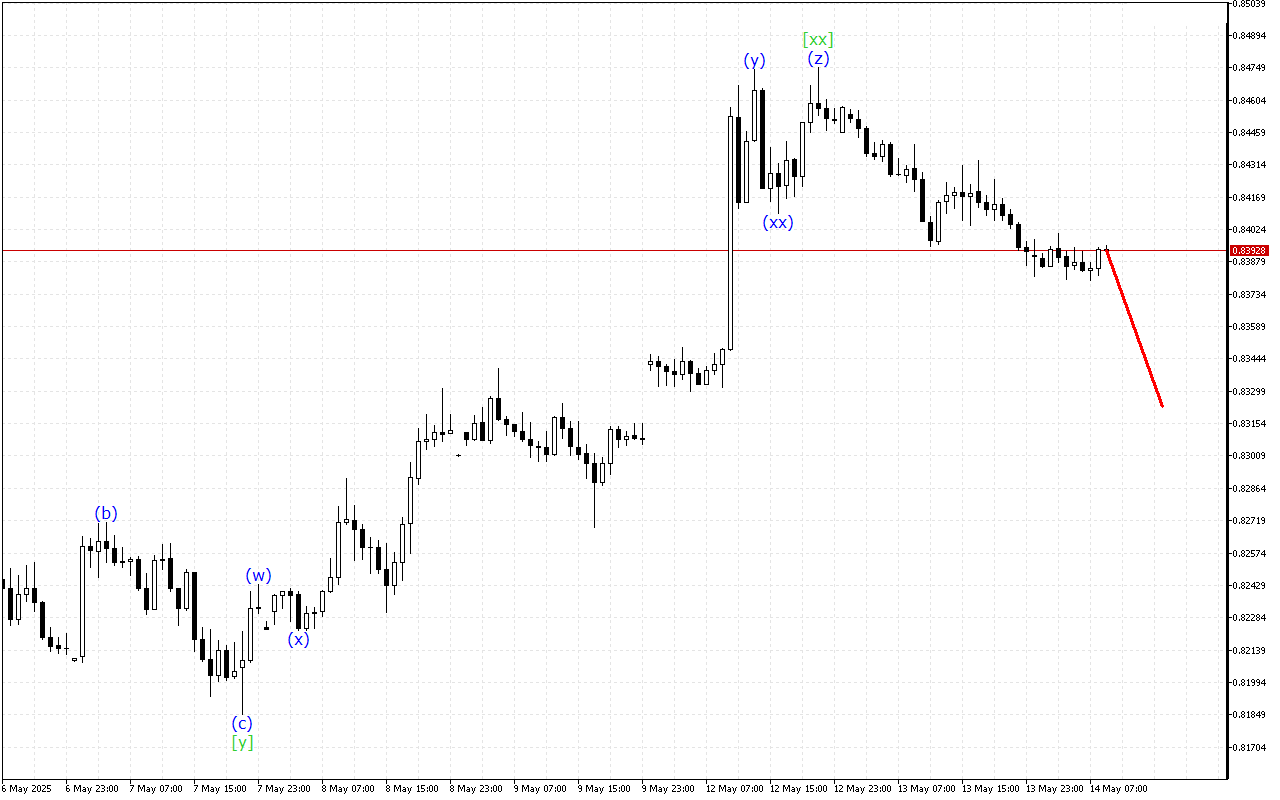
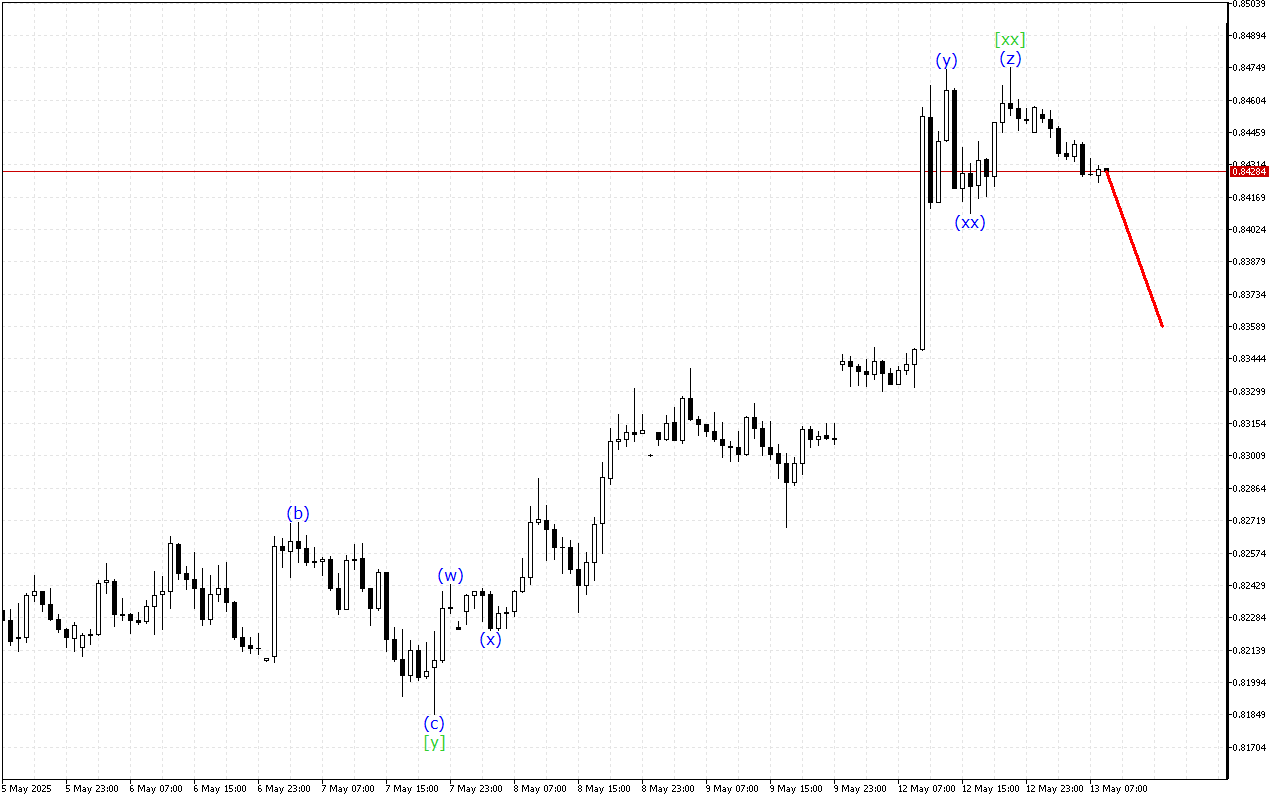
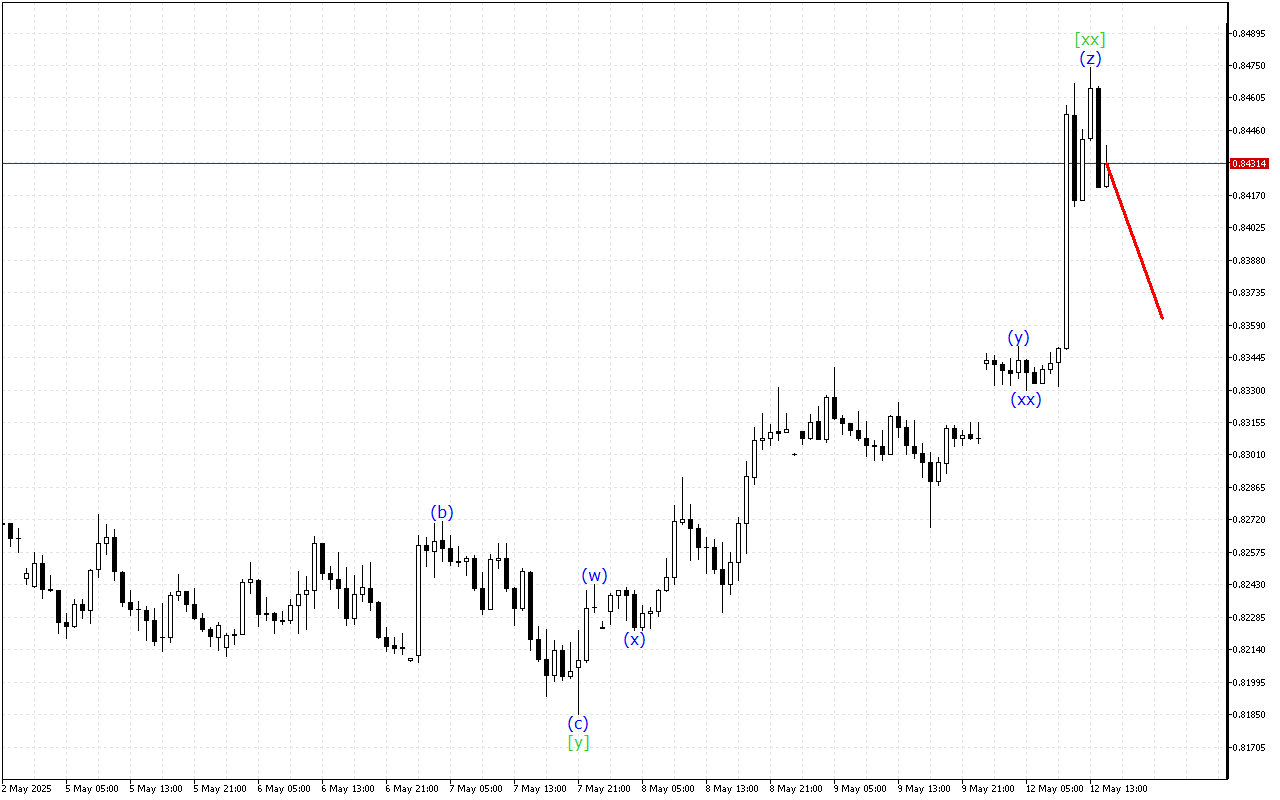
Although the market maintains an upward momentum prevalence, the USDCHF chart shows signs of a possible end to this trend.There…
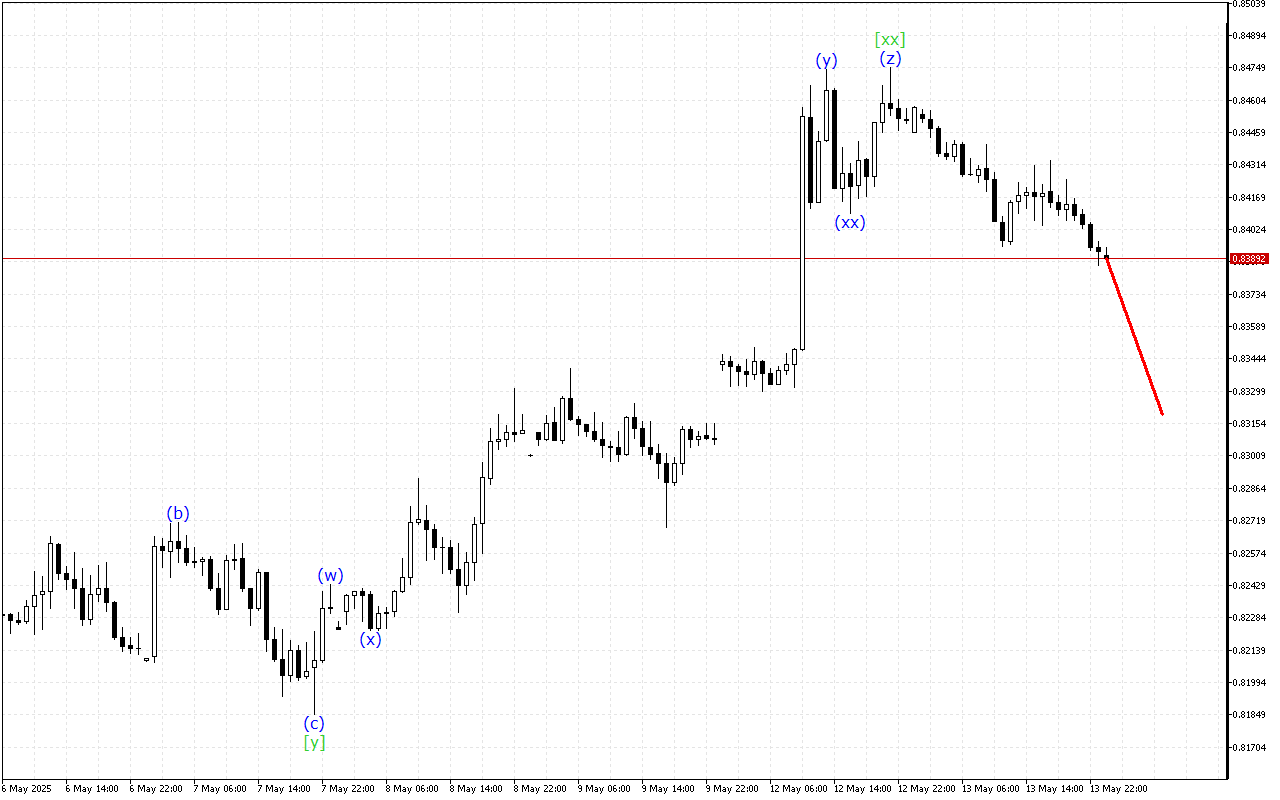
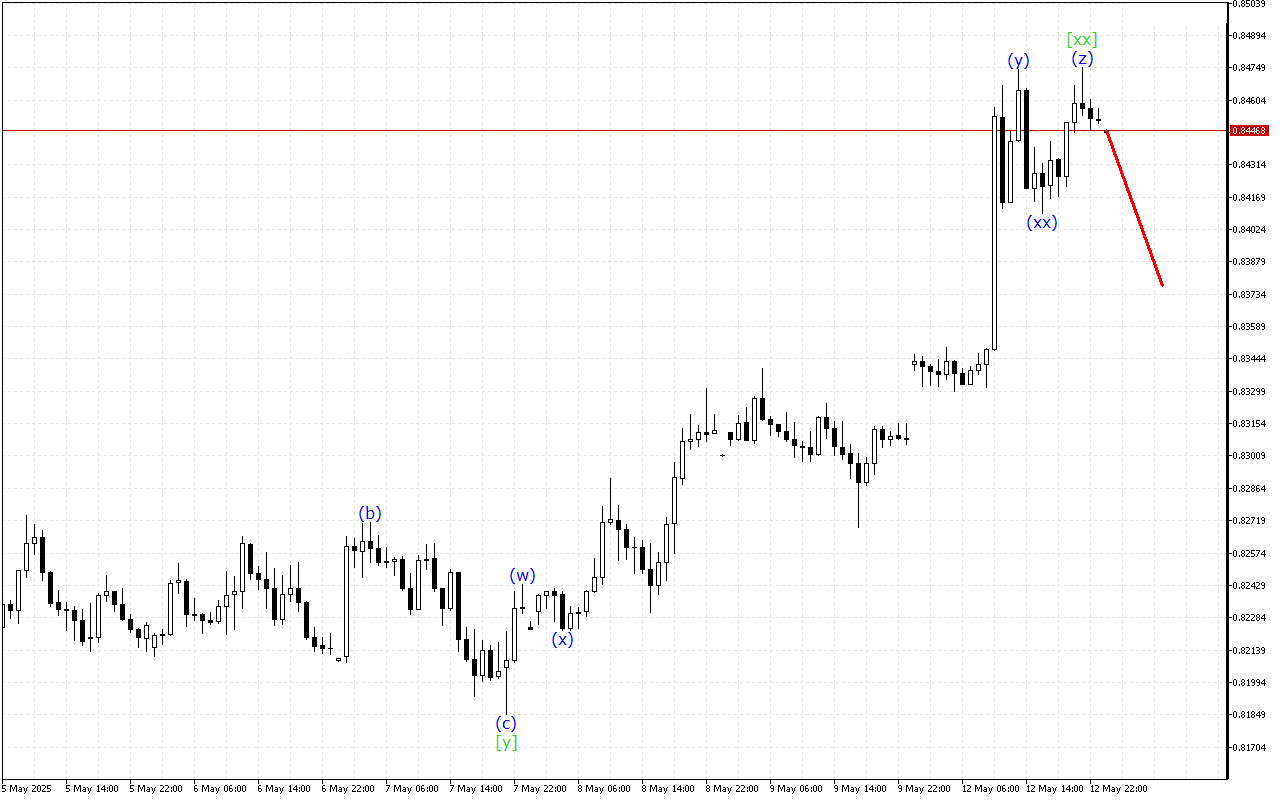
Amid general upward trend continuation, there are emerging signals pointing to a possible completion of the current uptrend in USDCHF.There…
The Natural Gas chart shows the continuation of mixed trading dynamics, reflecting the general uncertainty on the market.The current wave…
Amid general upward trend continuation, there are emerging signals pointing to a possible completion of the current uptrend in USDCHF.The…
Although the market maintains an upward momentum prevalence, the USDCHF chart shows signs of a possible end to this trend.The…
Although the market continues to move higher, the USDCHF chart is showing some signs of fatigue in the upward momentum.There…
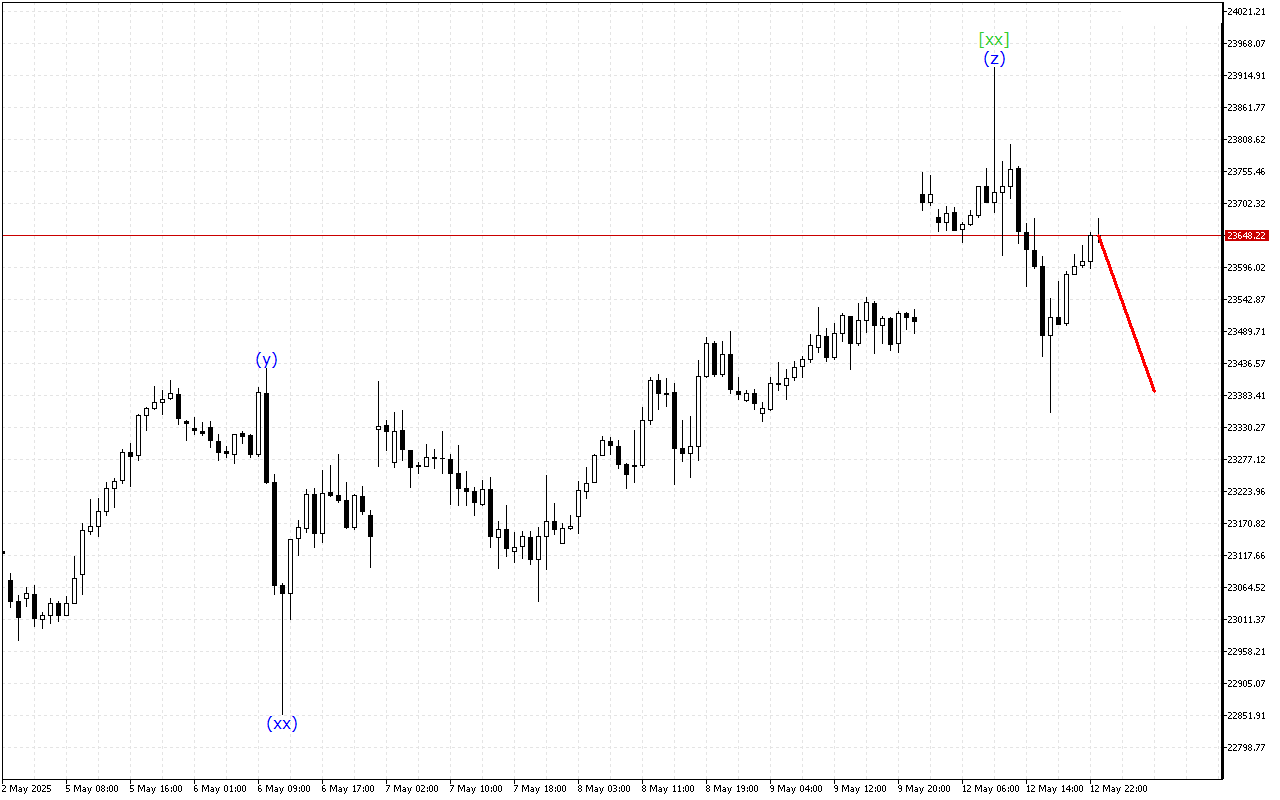
Amid general upward trend continuation, there are emerging signals pointing to a possible completion of the current uptrend in DAX…
The Natural Gas chart shows mixed dynamics, which indicates overall uncertainty and hints at a pause in decision-making.The wave structure…
Amid general upward trend continuation, there are emerging signals pointing to a possible completion of the current uptrend in USDCHF.The…