Natural Gas H1: Wave Analysis for the American Session on 12.5.2025
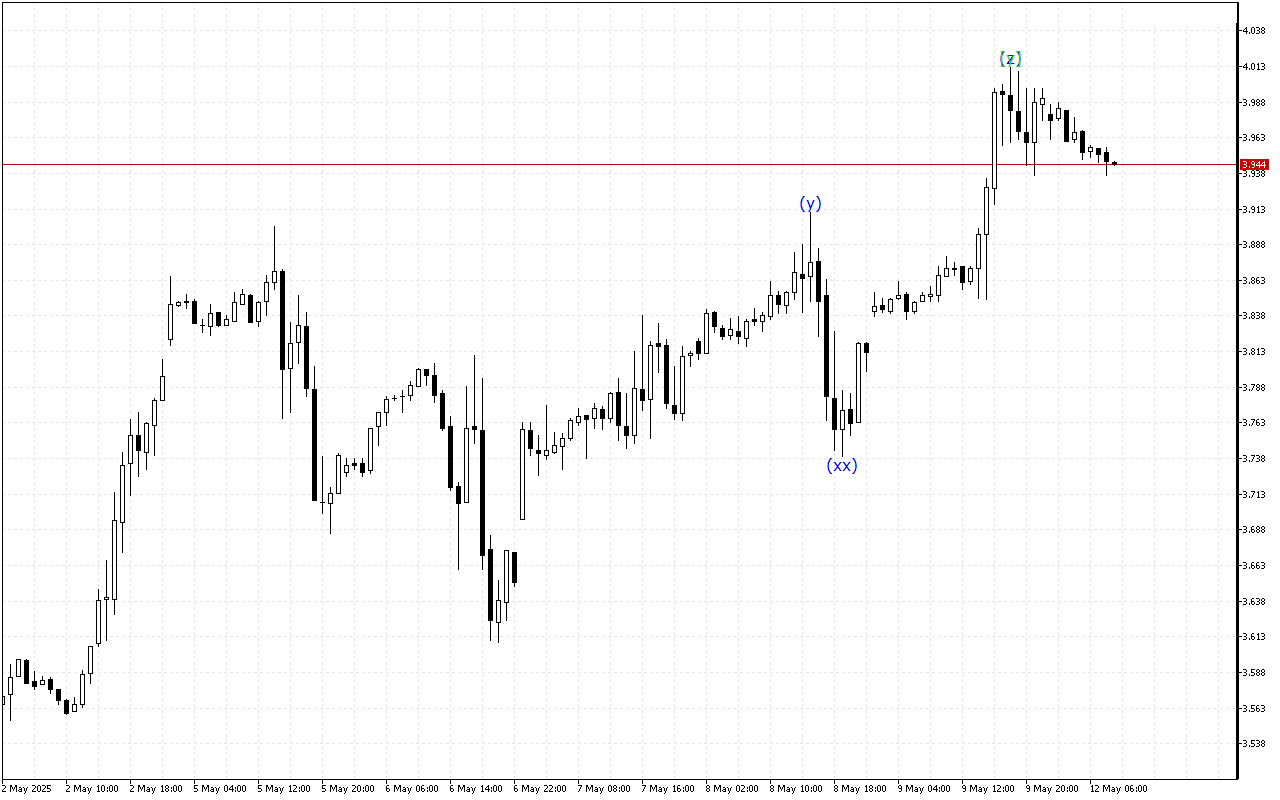
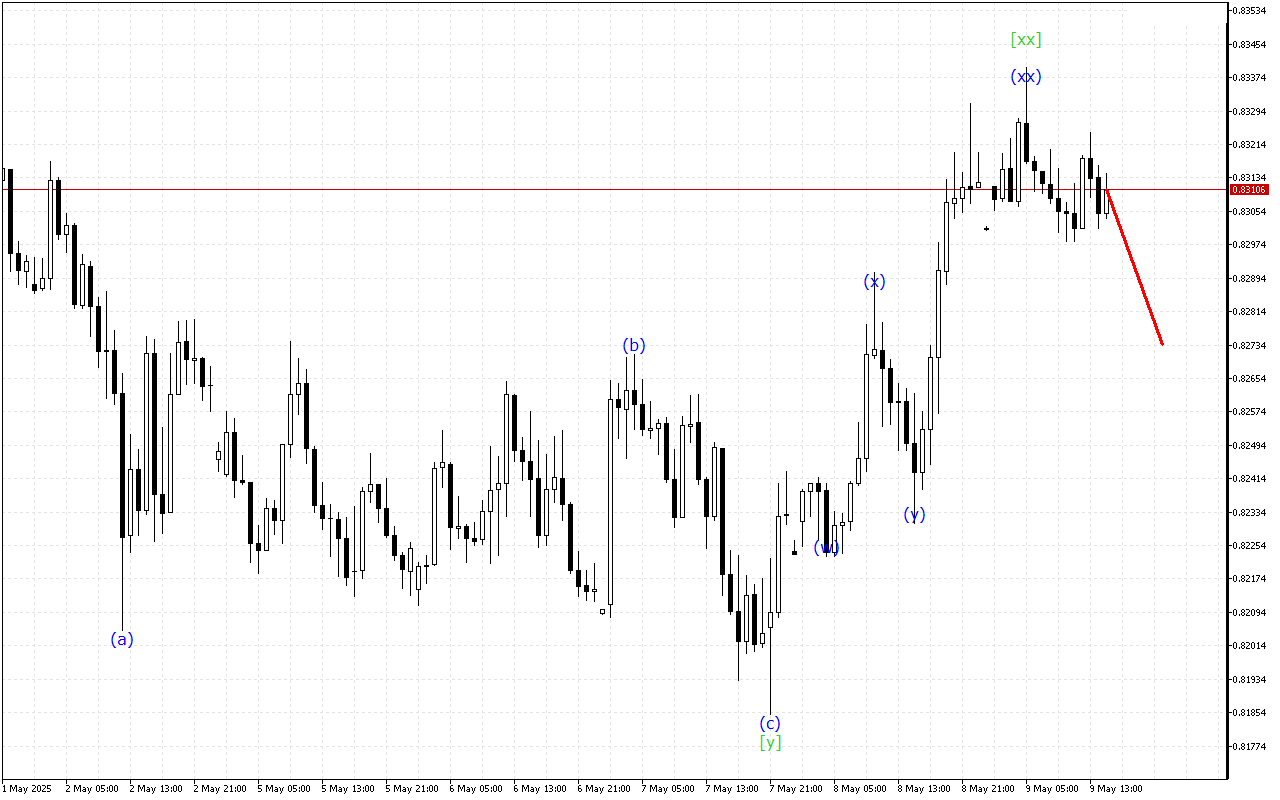
The Natural Gas chart shows mixed trading dynamics, with periods of both positive and negative price activity.The wave structure of…
The Natural Gas chart shows mixed trading dynamics, with periods of both positive and negative price activity.The wave structure of…
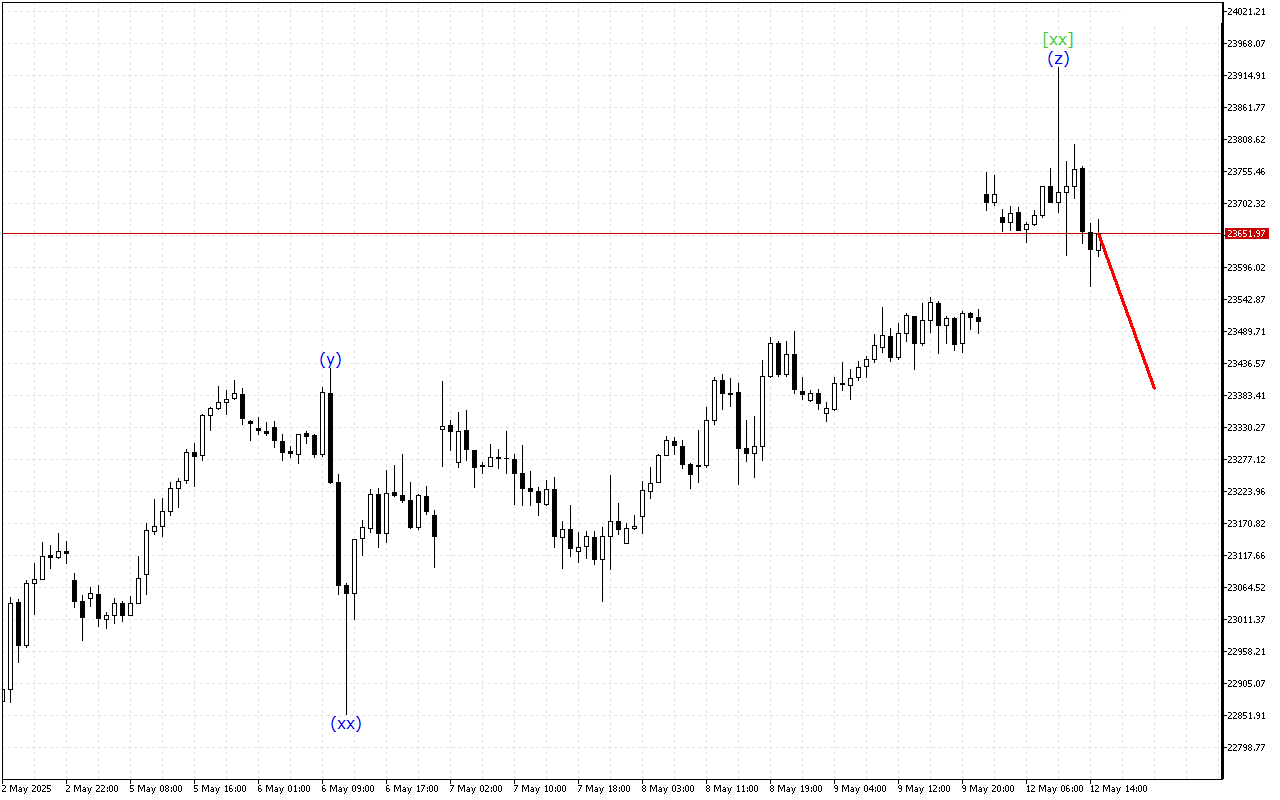
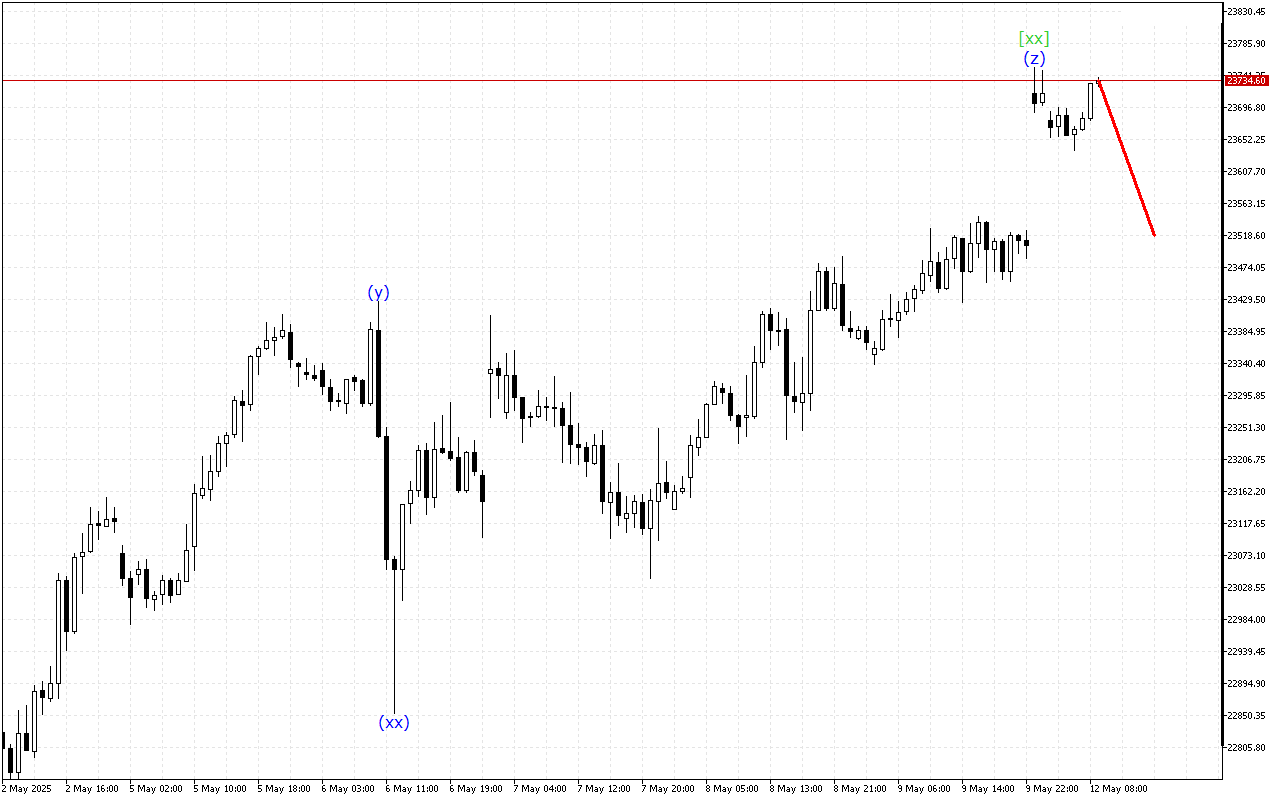
Although the market continues to move higher, the DAX 40 chart is showing some signs of fatigue in the upward…
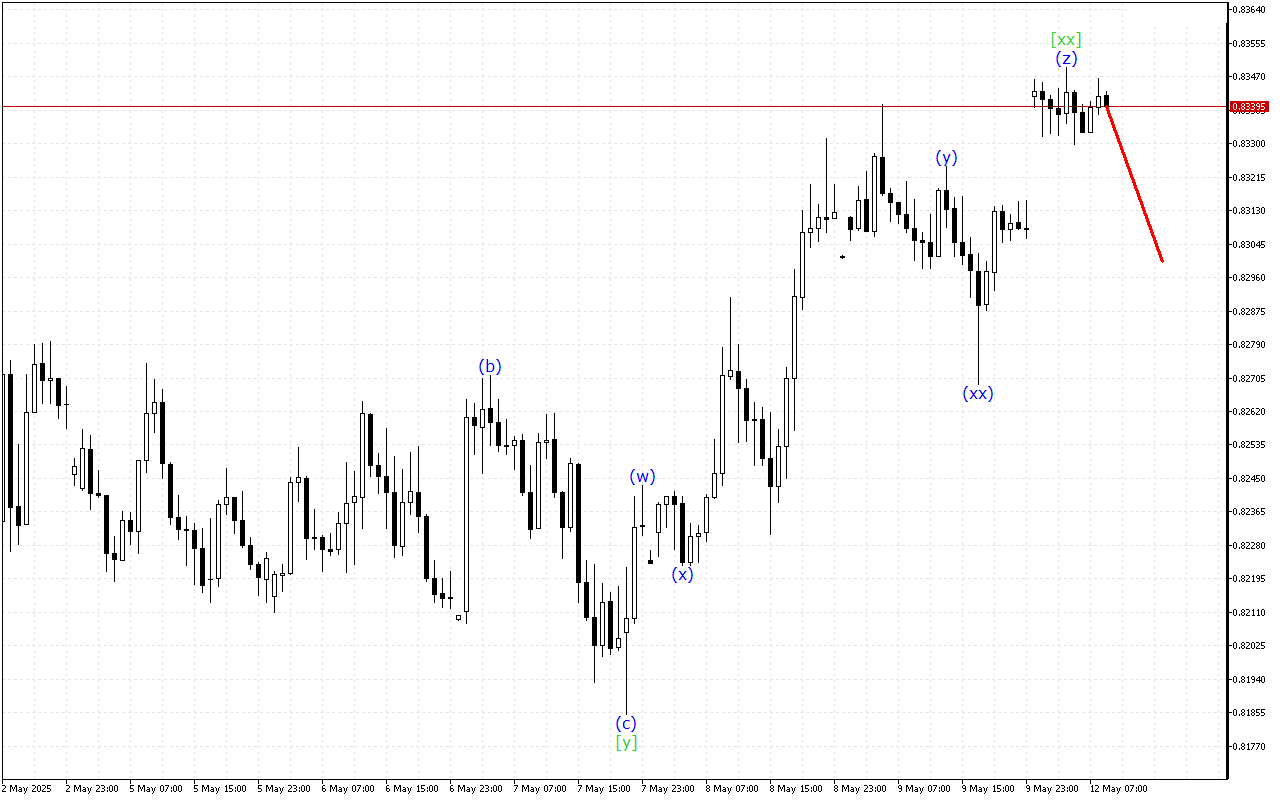
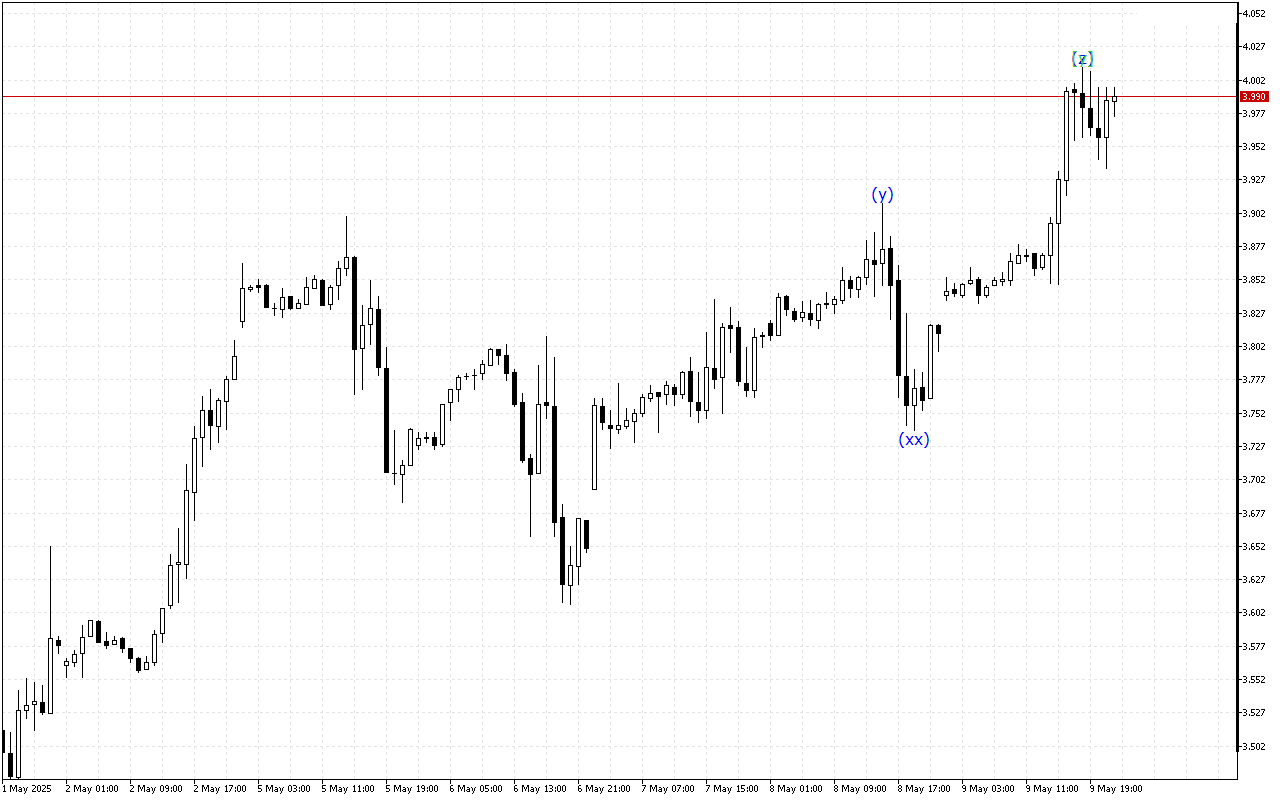
Although the market maintains an upward momentum prevalence, the USDCHF chart shows signs of a possible end to this trend.The…
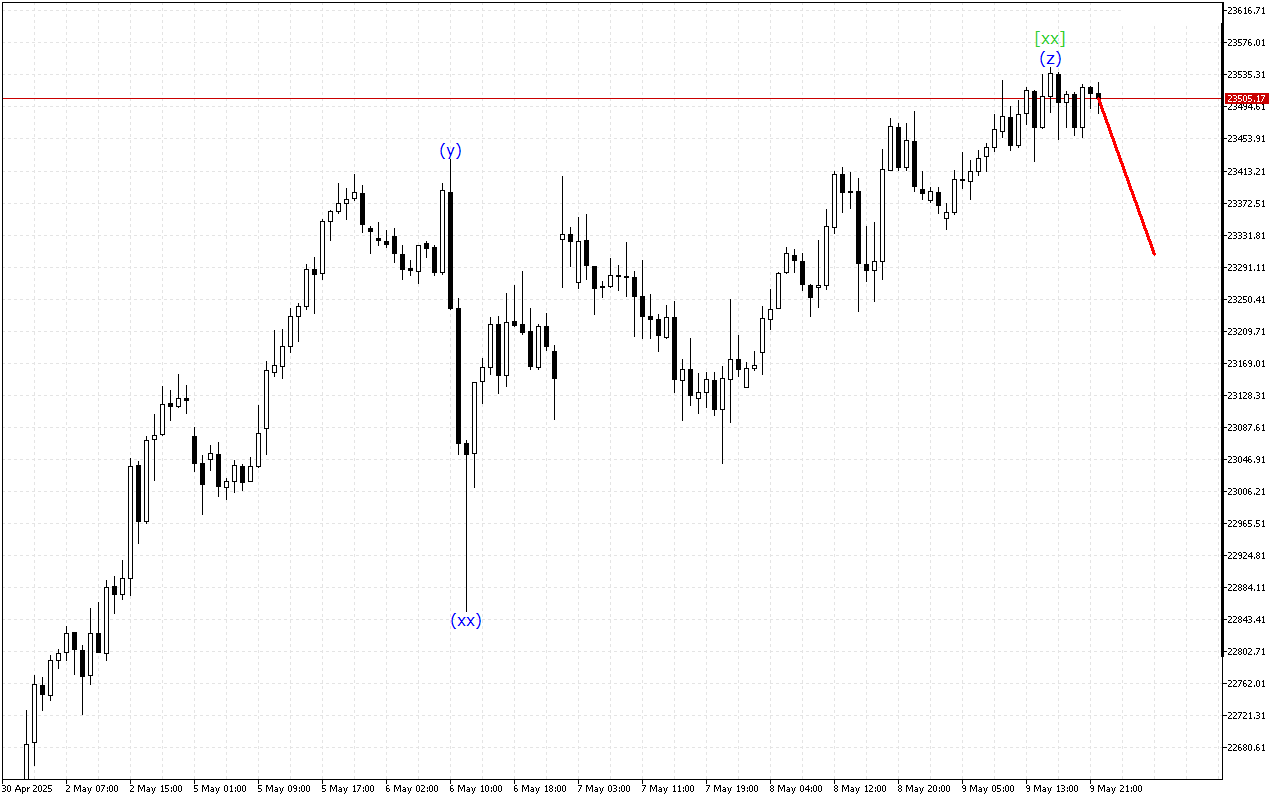
The price continues to move upward, but on the DAX 40 chart you can see signs of an impending completion…
The nature of the price movement on the Natural Gas chart remains mixed. The tool predominantly maintains the sideways direction.The…
The Natural Gas chart shows mixed dynamics, which indicates overall uncertainty and hints at a pause in decision-making.The wave structure…
Although the market maintains an upward momentum prevalence, the USDCHF chart shows signs of a possible end to this trend.There…
The price continues to move upward, but on the DAX 40 chart you can see signs of an impending completion…
Although the market continues to move higher, the USDCHF chart is showing some signs of fatigue in the upward momentum.There…
Although the market maintains an upward momentum prevalence, the DAX 40 chart shows signs of a possible end to this…