Natural Gas H1: Wave Analysis for the American Session on 9.5.2025
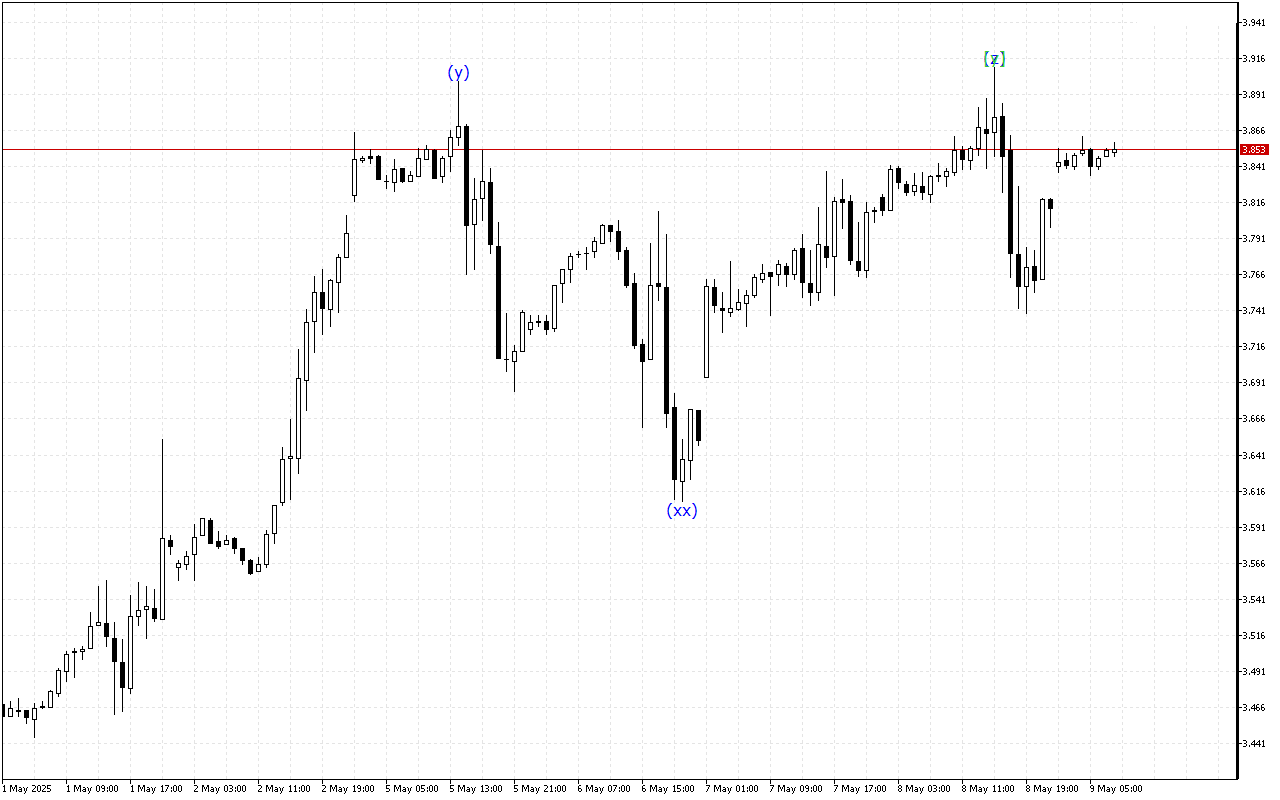
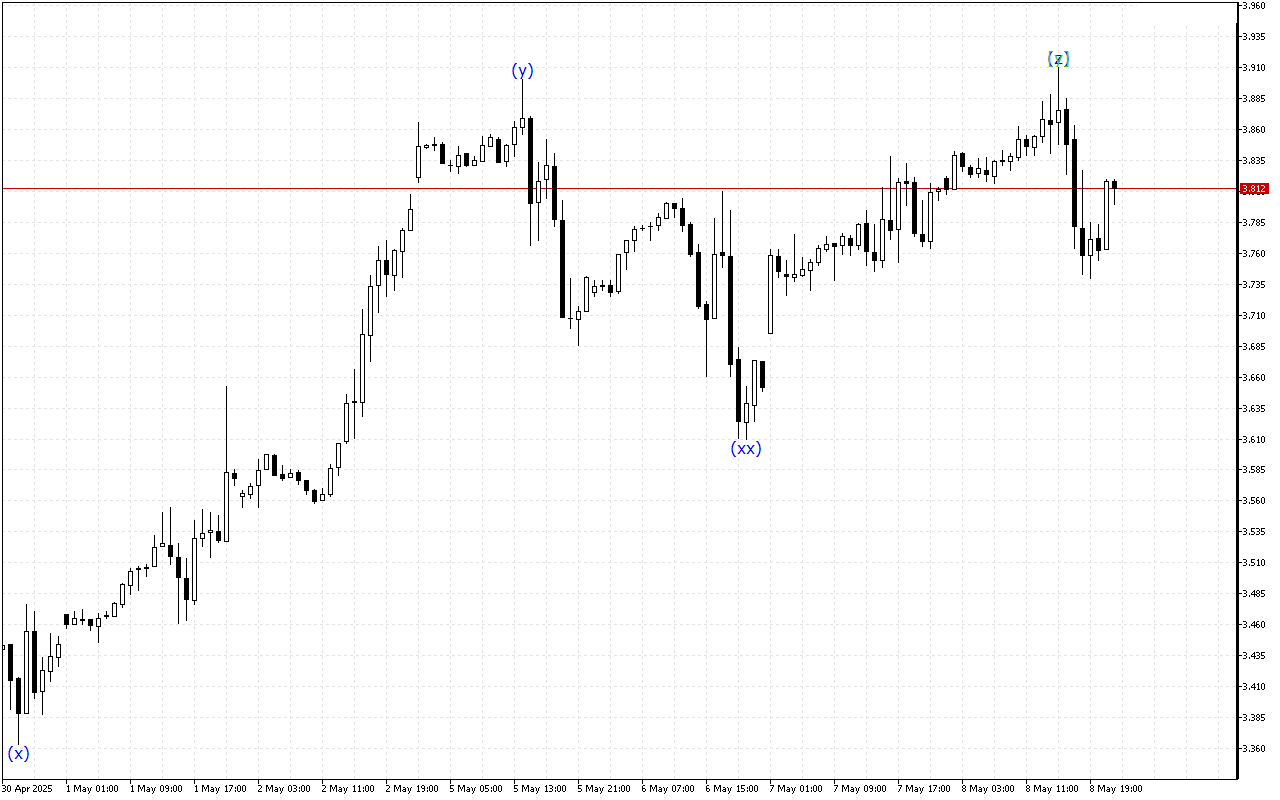
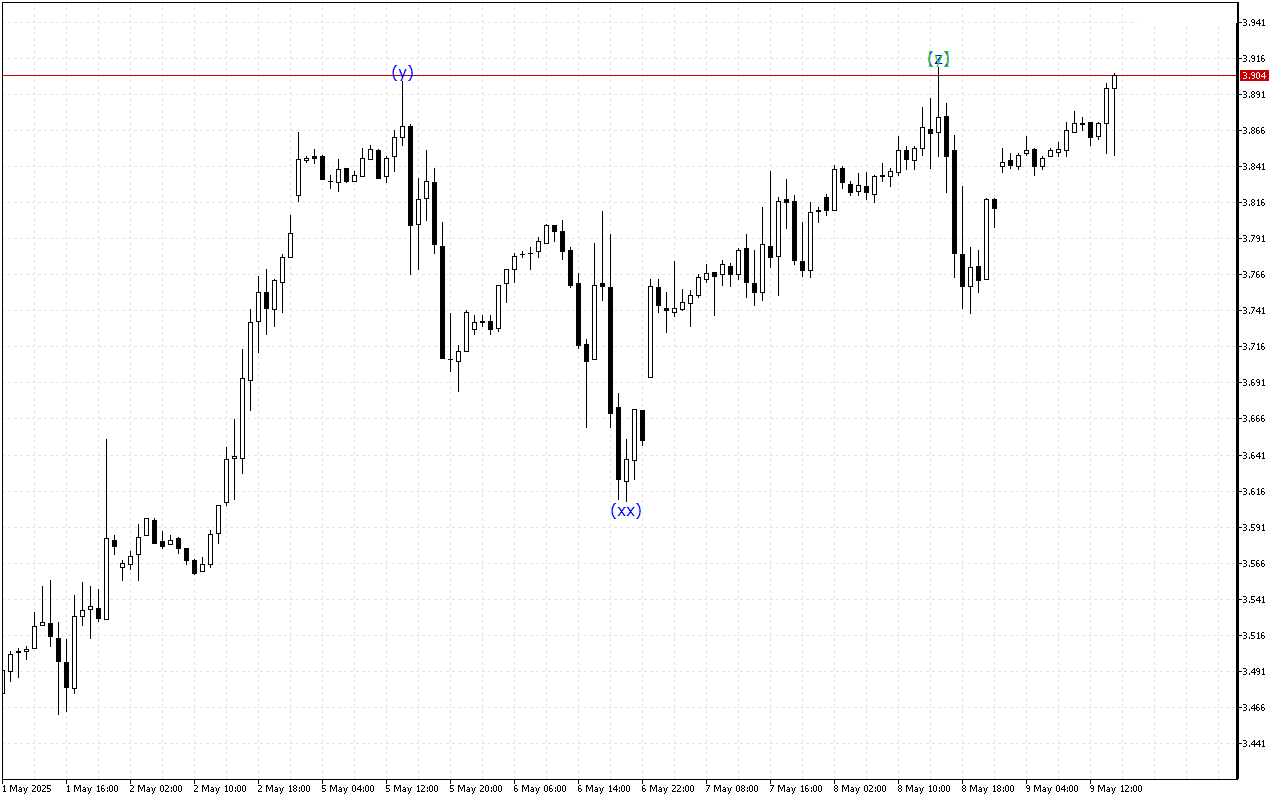
The Natural Gas chart shows the continuation of mixed trading dynamics, reflecting the general uncertainty on the market.The wave structure…
The Natural Gas chart shows the continuation of mixed trading dynamics, reflecting the general uncertainty on the market.The wave structure…
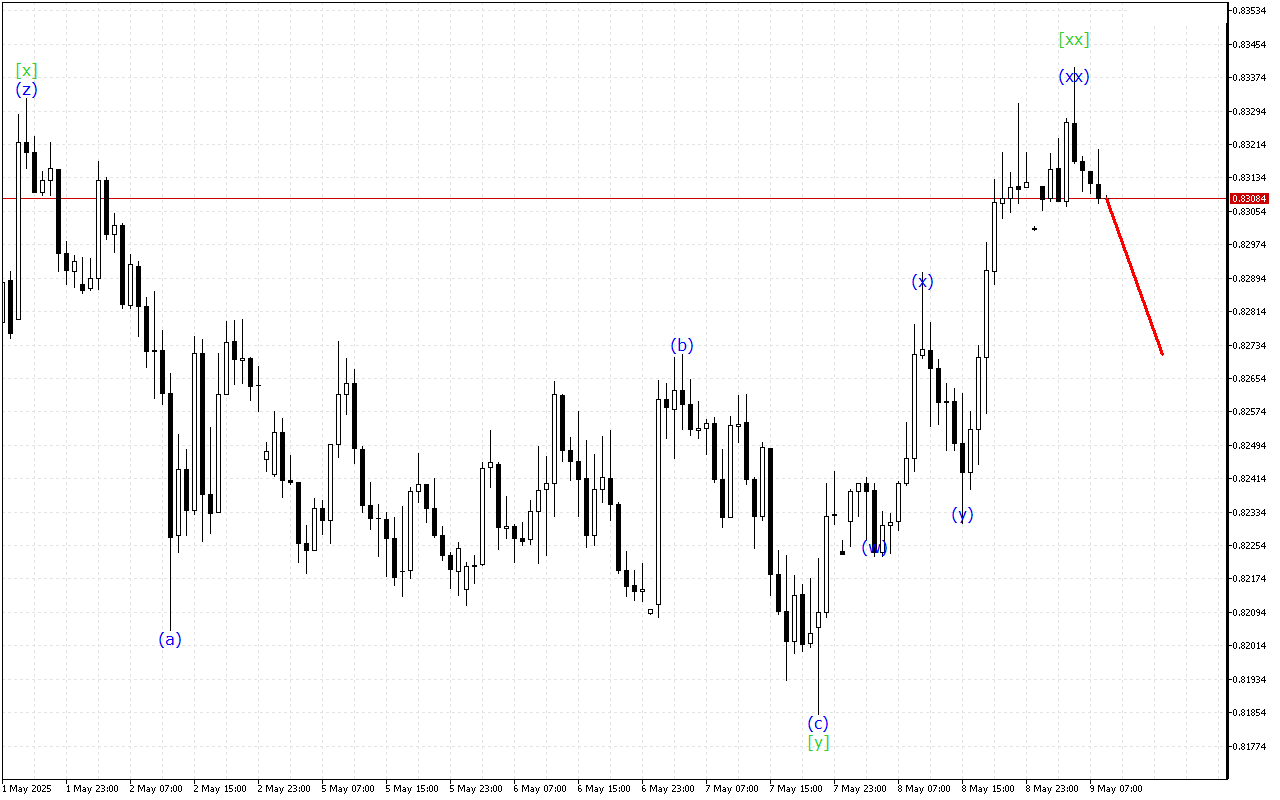
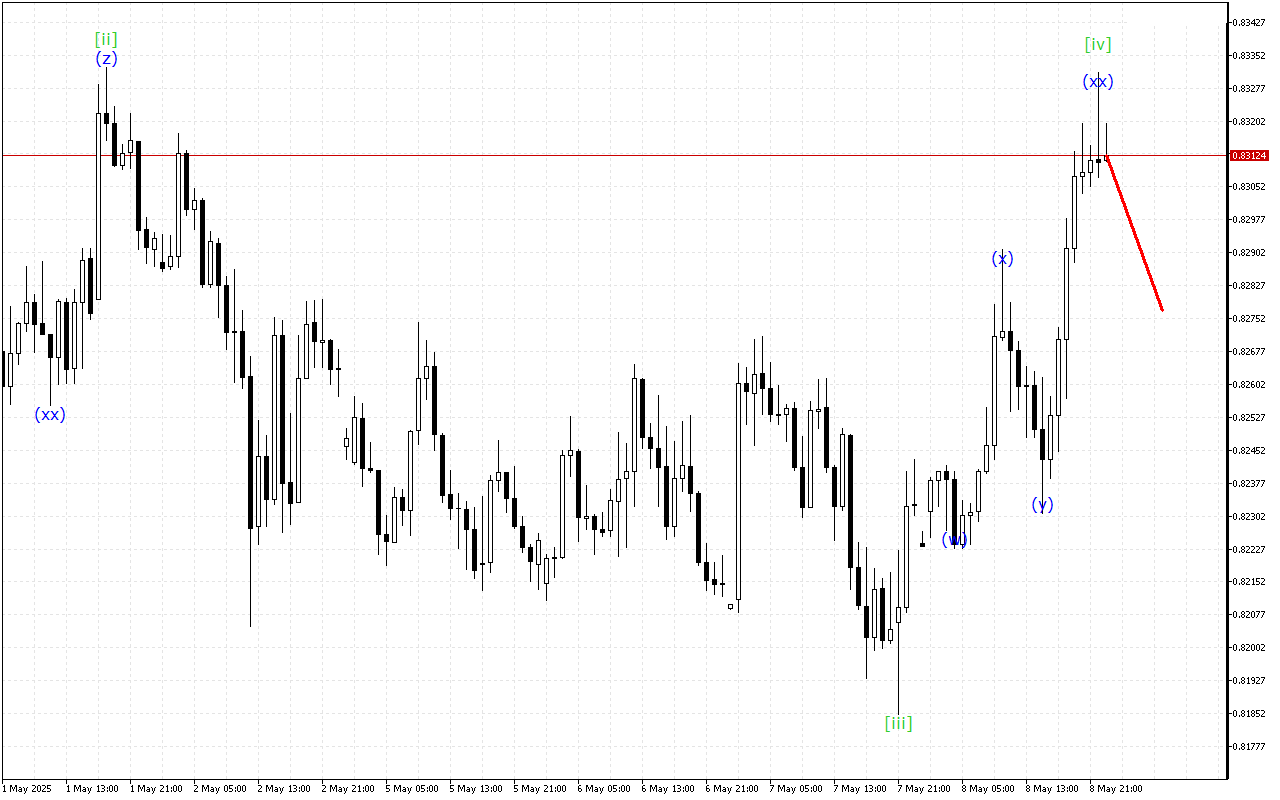
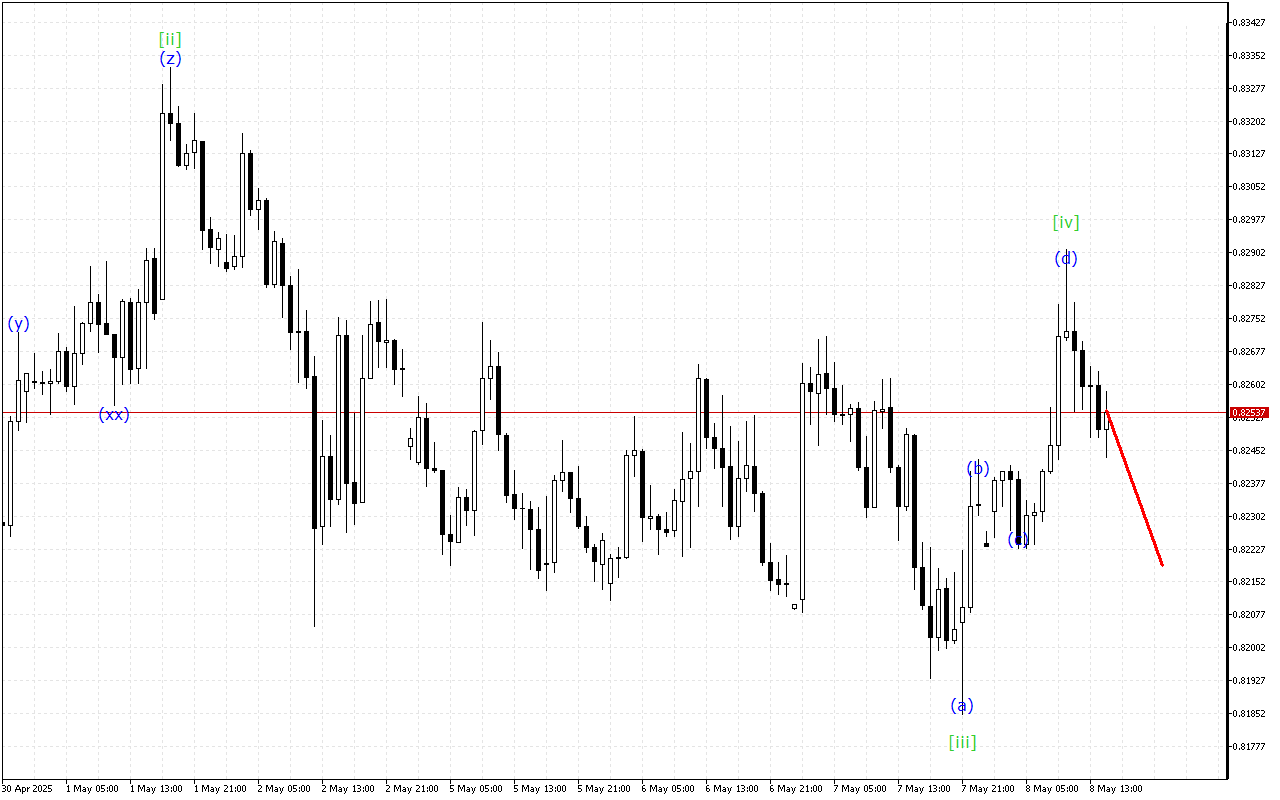
Although the market maintains an upward momentum prevalence, the USDCHF chart shows signs of a possible end to this trend.There…
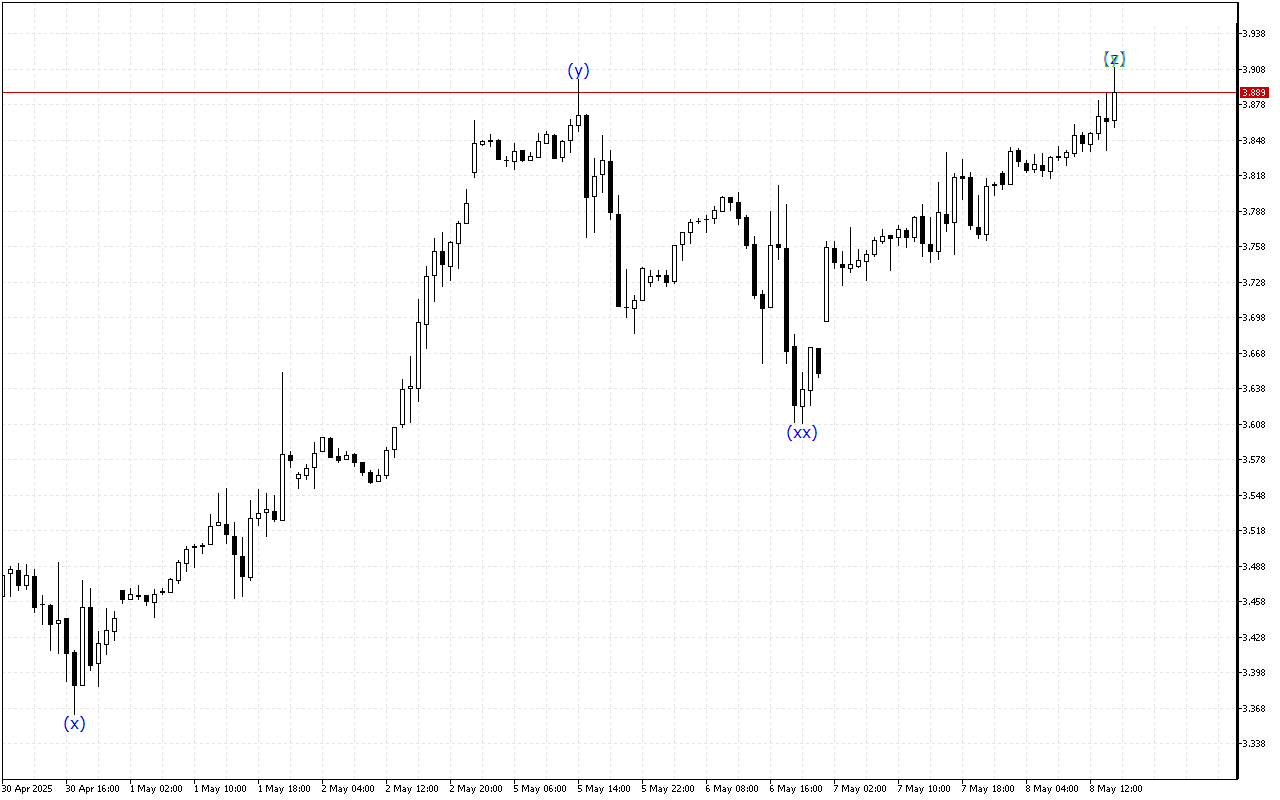
The Natural Gas chart maintains mixed trading dynamics, reflecting the lack of consensus between optimists and pessimists.The wave structure indicates…
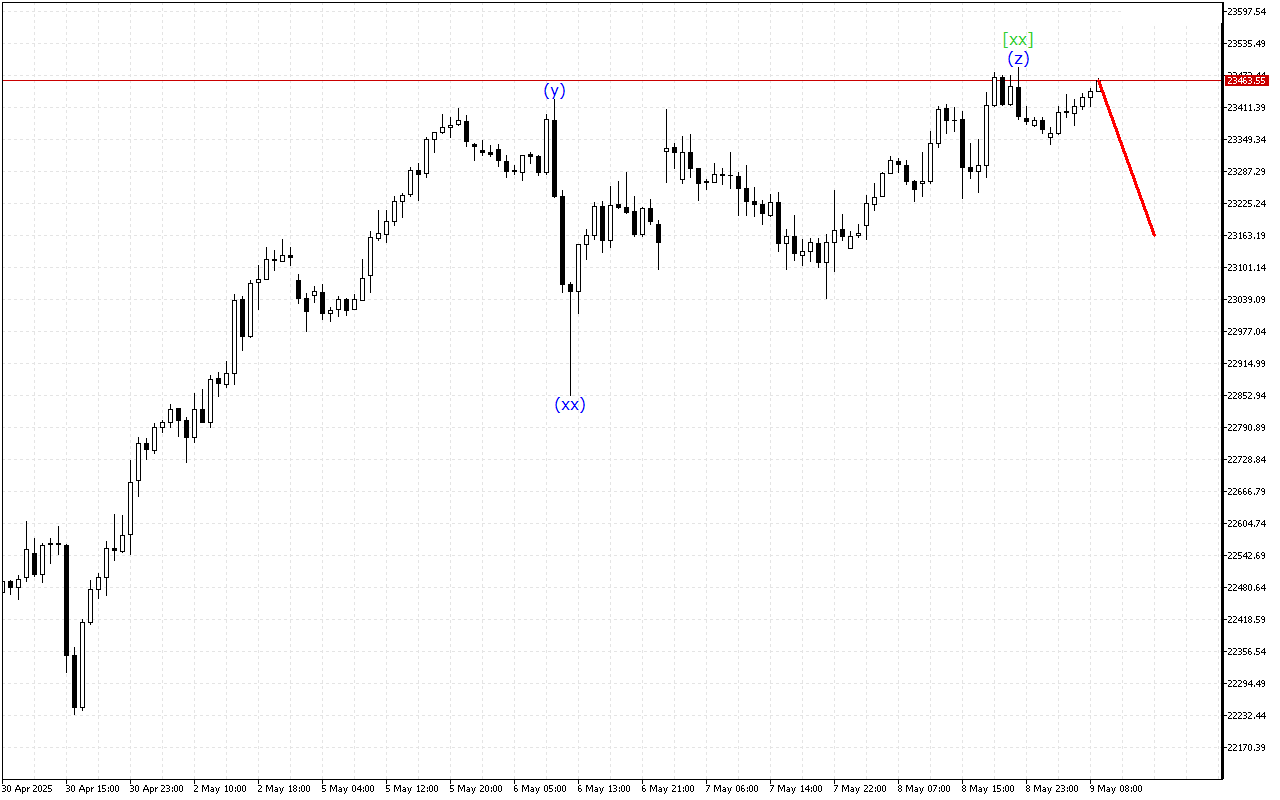
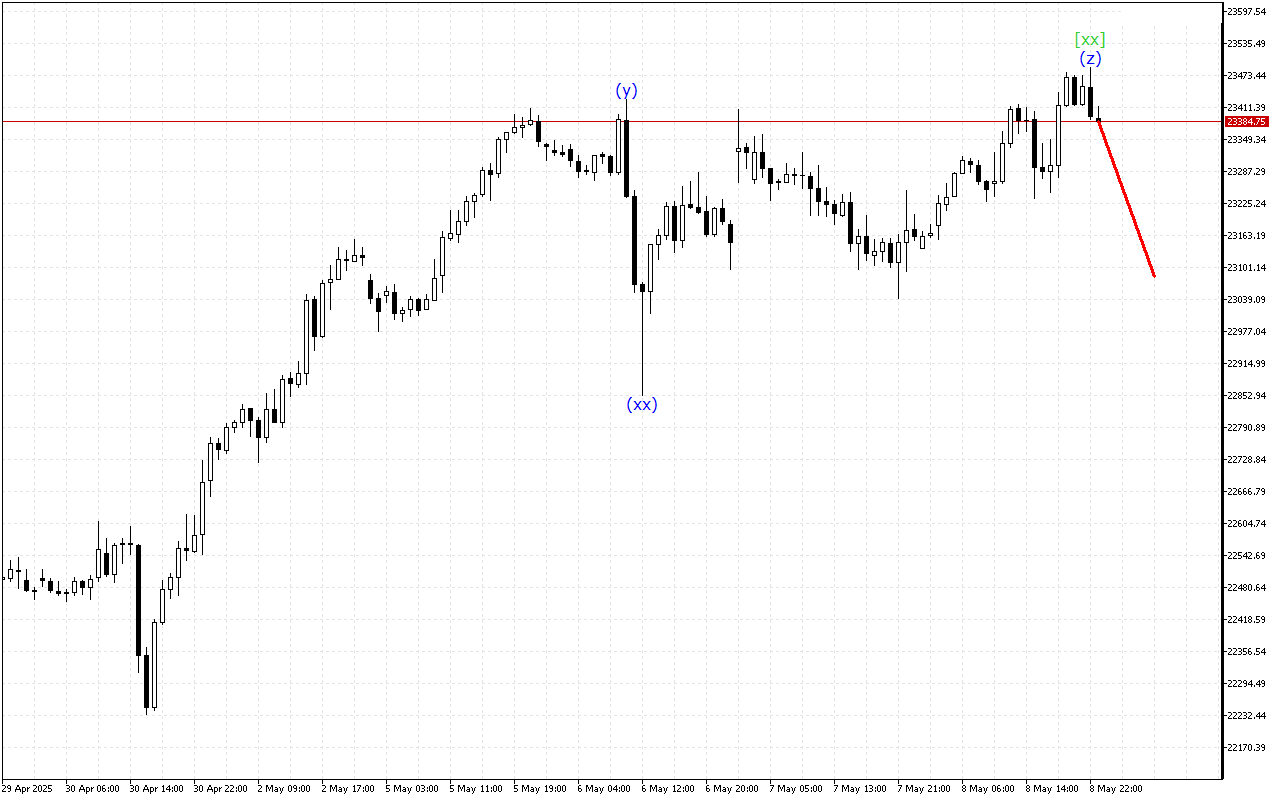
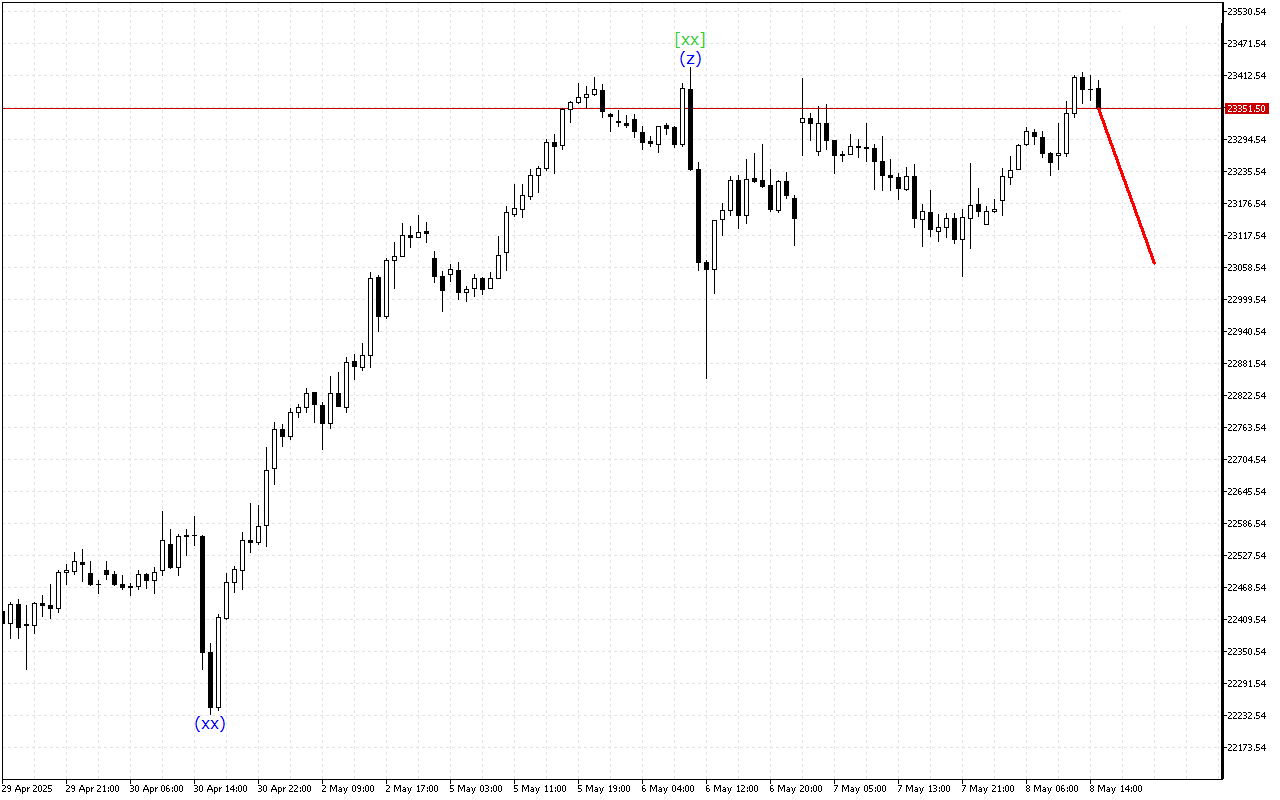
Amid general upward trend continuation, there are emerging signals pointing to a possible completion of the current uptrend in DAX…
The DAX 40 chart shows signals for the end of the upward movement phase.The current dynamics of the movement indicate…
The nature of the price movement on the Natural Gas chart remains mixed. The tool predominantly maintains the sideways direction.The…
Although the market maintains an upward momentum prevalence, the USDCHF chart shows signs of a possible end to this trend.Within…
Although the market maintains an upward momentum prevalence, the DAX 40 chart shows signs of a possible end to this…
The Natural Gas chart shows the continuation of mixed trading dynamics, reflecting the general uncertainty on the market.The wave structure…
Although the market maintains an upward momentum prevalence, the USDCHF chart shows signs of a possible end to this trend.The…