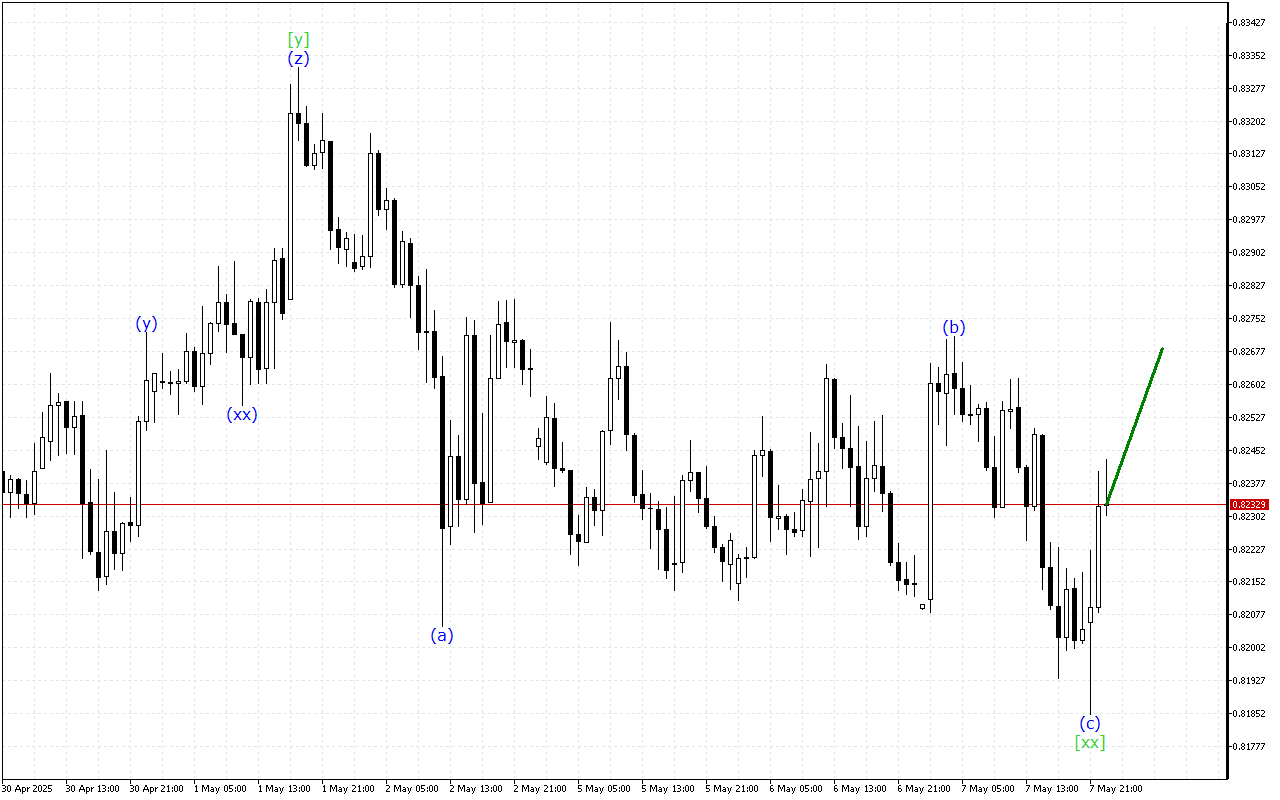
USDCHF H1: Wave Analysis for the European Session on 8.5.2025
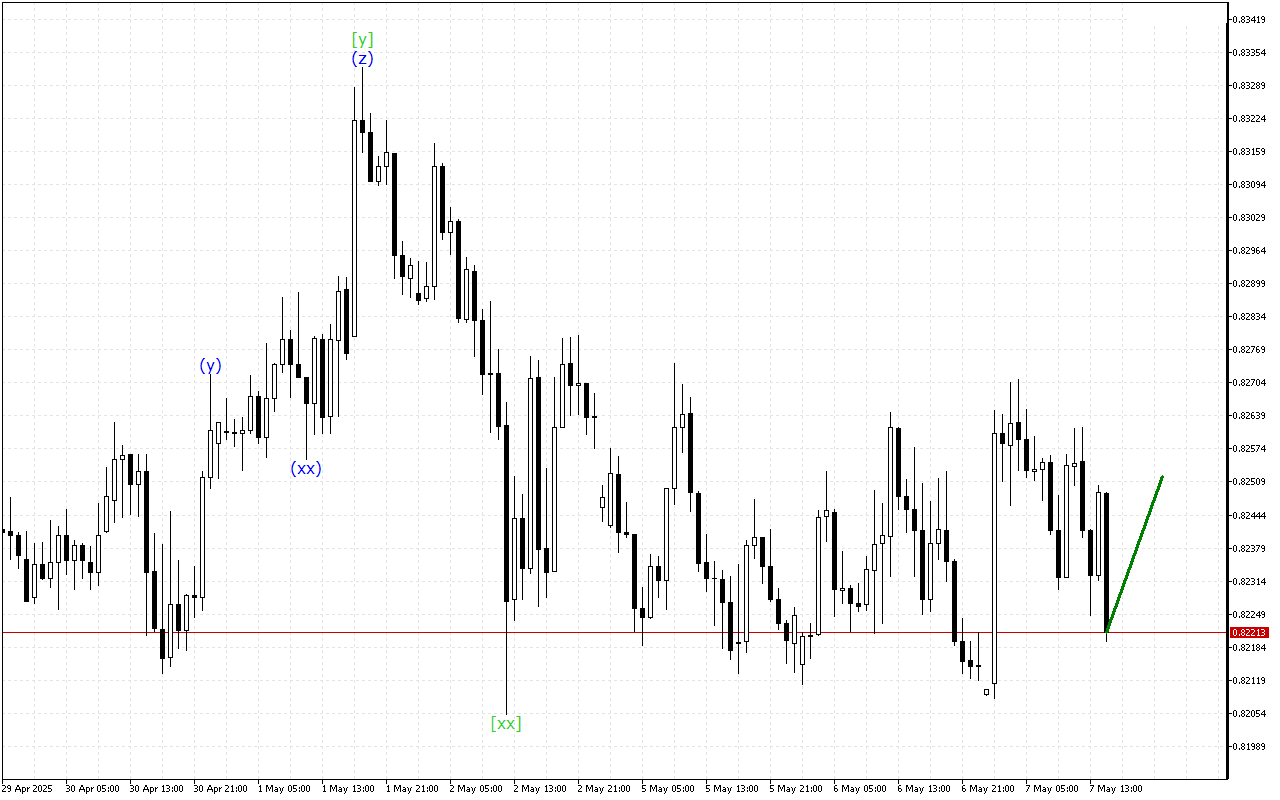
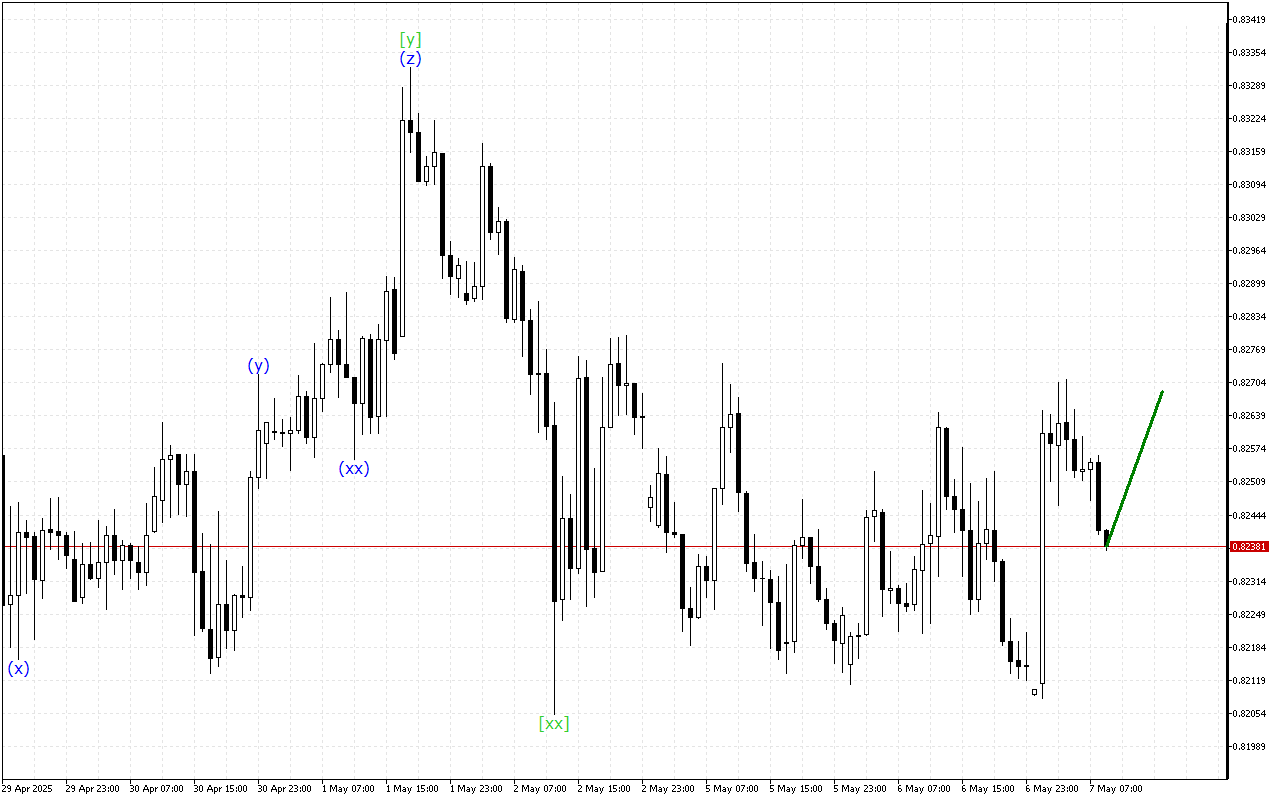
The market is still heading down, but the chart shows signs that the current trend will end soon.The medium-term movement…
The market is still heading down, but the chart shows signs that the current trend will end soon.The medium-term movement…
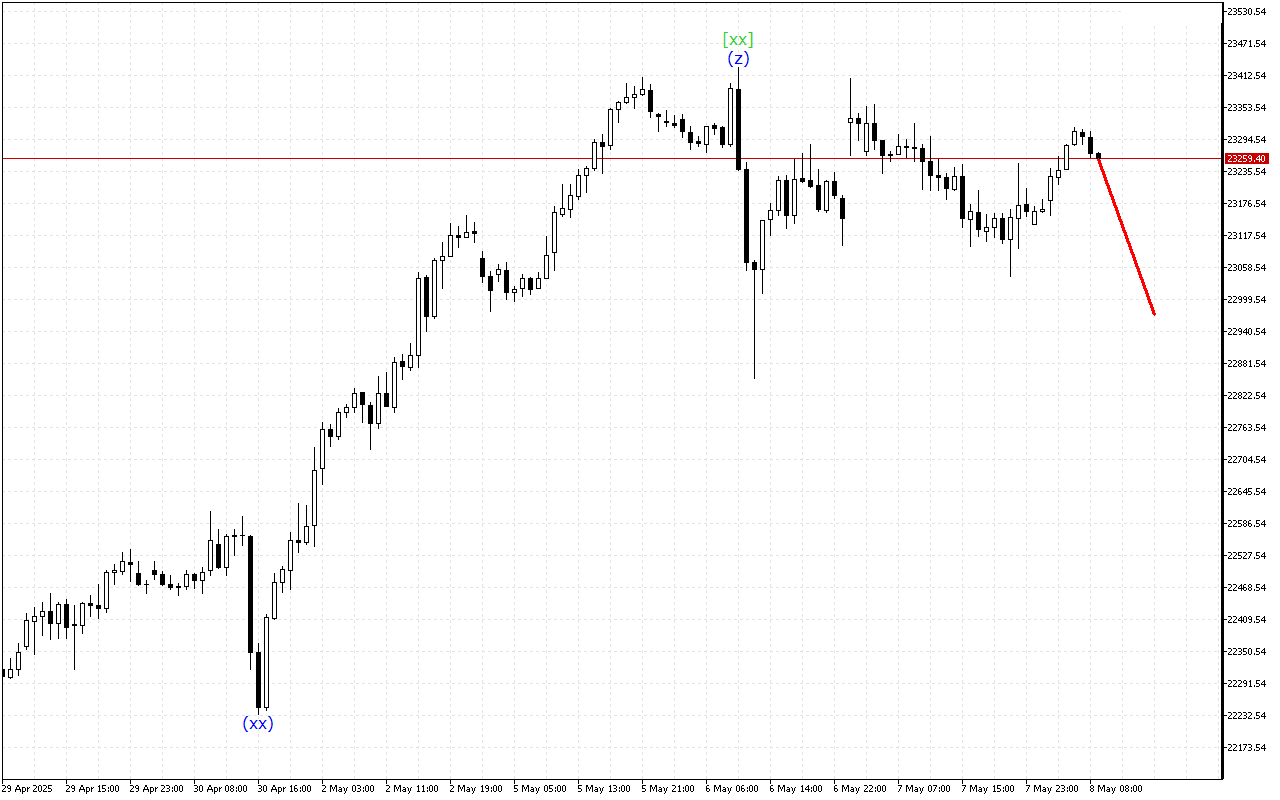
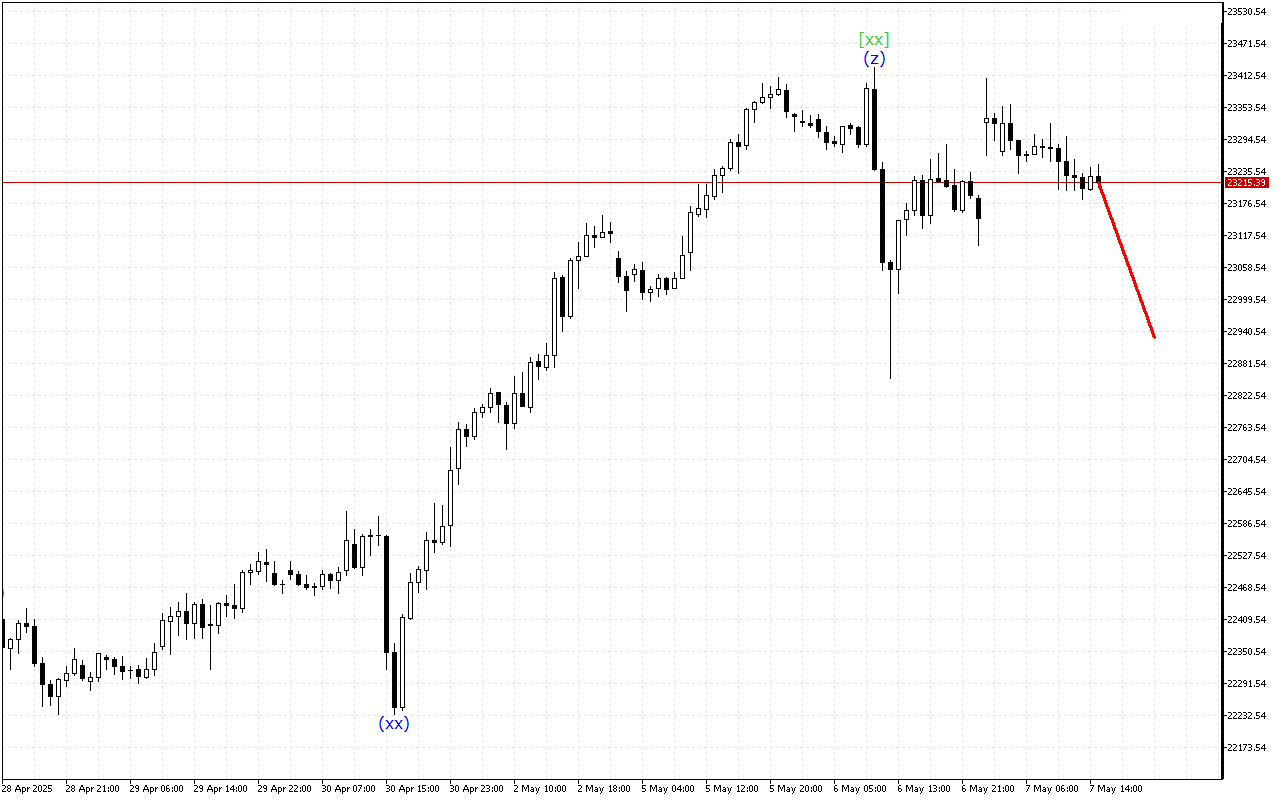
The DAX 40 chart shows signals for the end of the upward movement phase.The current dynamics of the movement indicate…
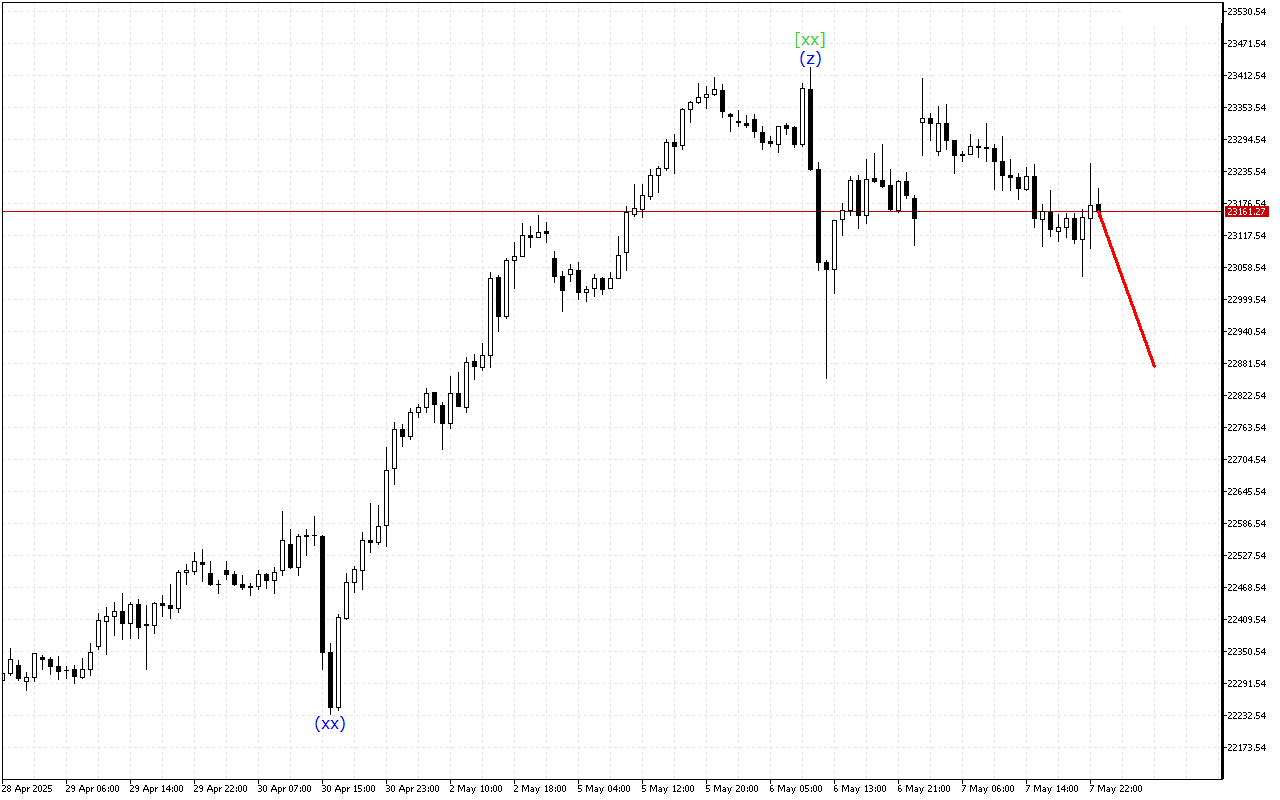
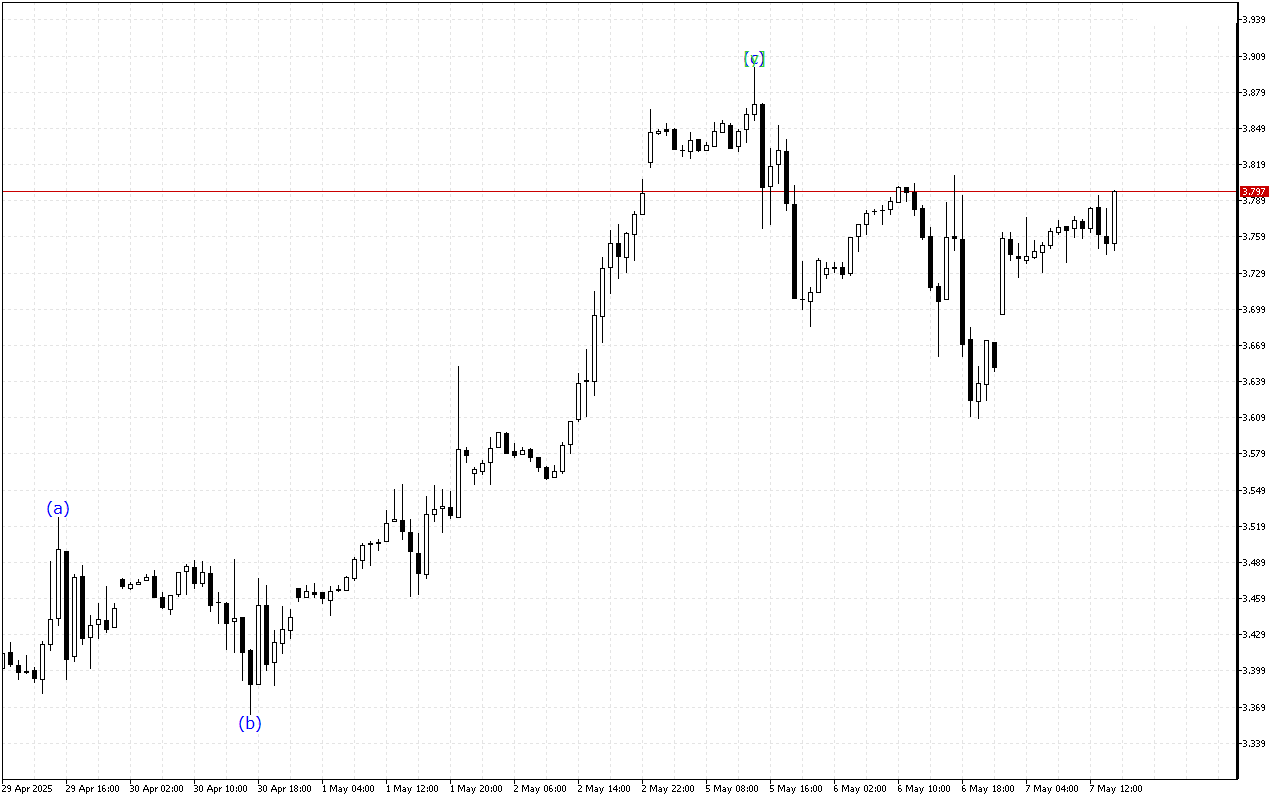
The Natural Gas chart maintains mixed trading dynamics, reflecting the lack of consensus between optimists and pessimists.The wave structure of…
Although the market continues to move higher, the DAX 40 chart is showing some signs of fatigue in the upward…
The nature of the price movement on the Natural Gas chart remains mixed. The tool predominantly maintains the sideways direction.The…
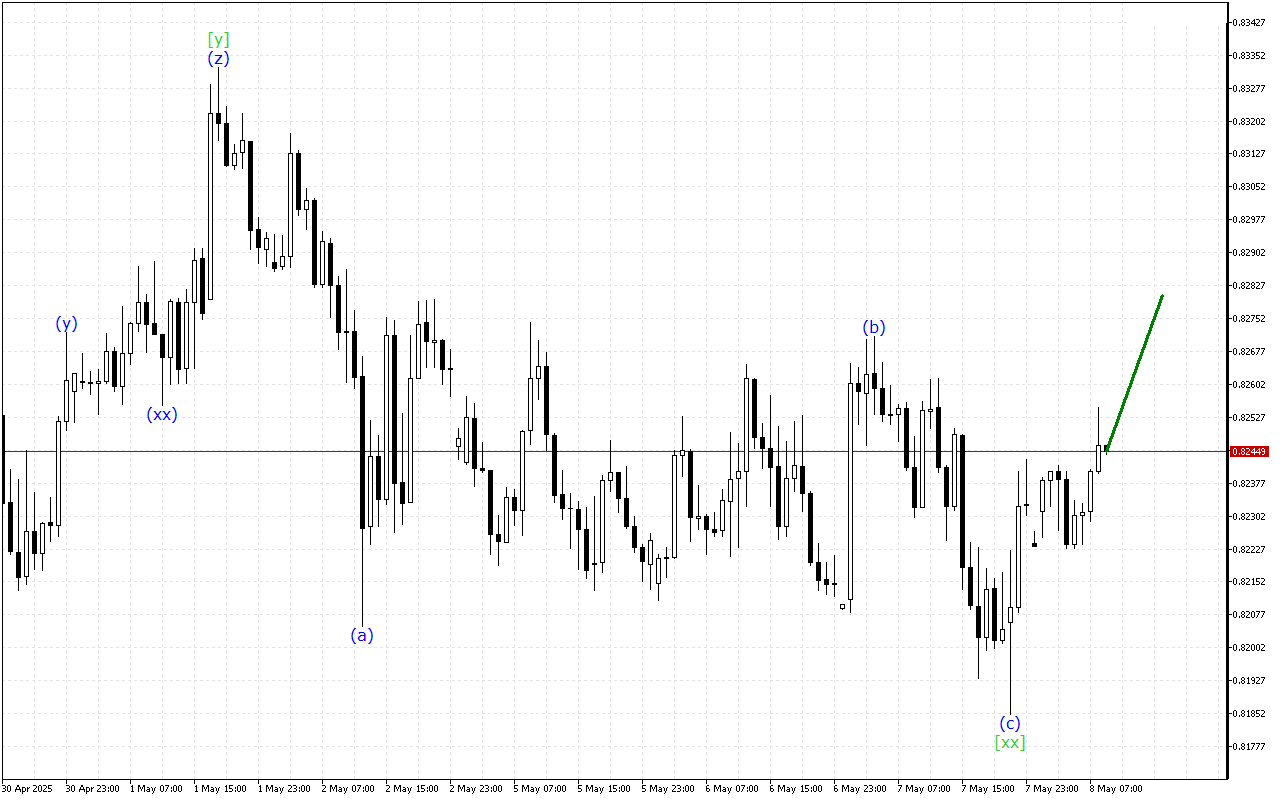
Despite the decline, there are signals on the USDCHF chart indicating a possible upcoming change in direction.The medium-term movement vector…
The DAX 40 chart shows signals for the end of the upward movement phase.The current dynamics of the movement indicate…
The Natural Gas chart maintains mixed trading dynamics, reflecting the lack of consensus between optimists and pessimists.The wave structure indicates…
Despite the decline, there are signals on the USDCHF chart indicating a possible upcoming change in direction.The medium-term movement vector…
Despite the decline, there are signals on the USDCHF chart indicating a possible upcoming change in direction.USDCHF continues to move…