USDCHF H1: Wave Analysis for the Asian Session on 20.6.2025
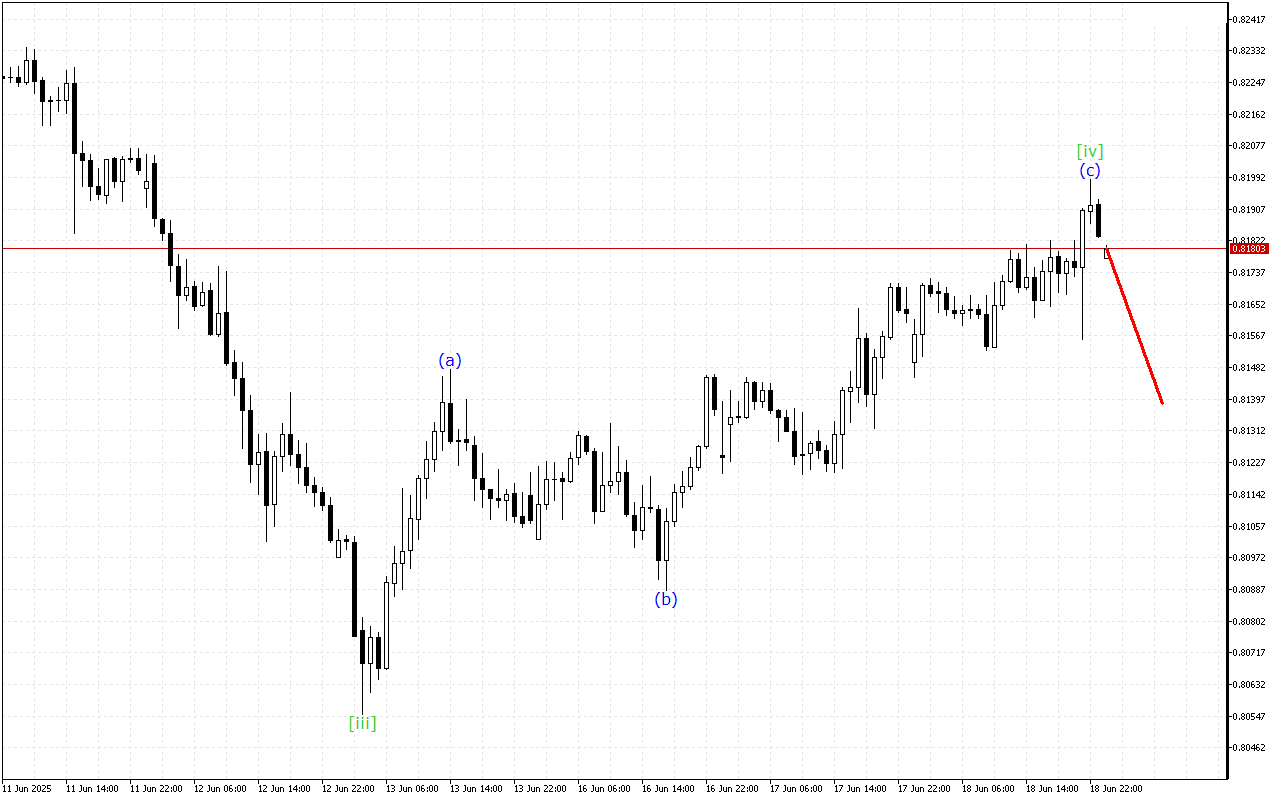
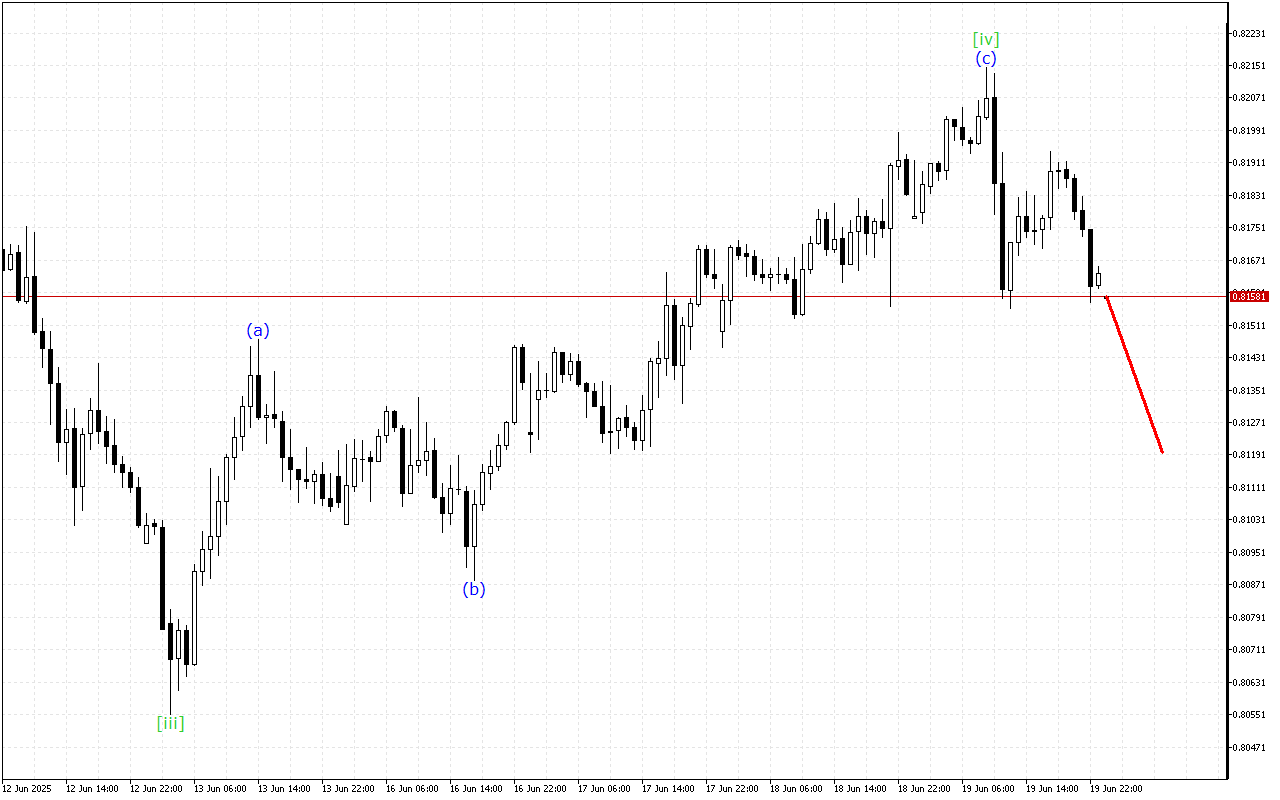
Amid general upward trend continuation, there are emerging signals pointing to a possible completion of the current uptrend in USDCHF.Within…
Amid general upward trend continuation, there are emerging signals pointing to a possible completion of the current uptrend in USDCHF.Within…
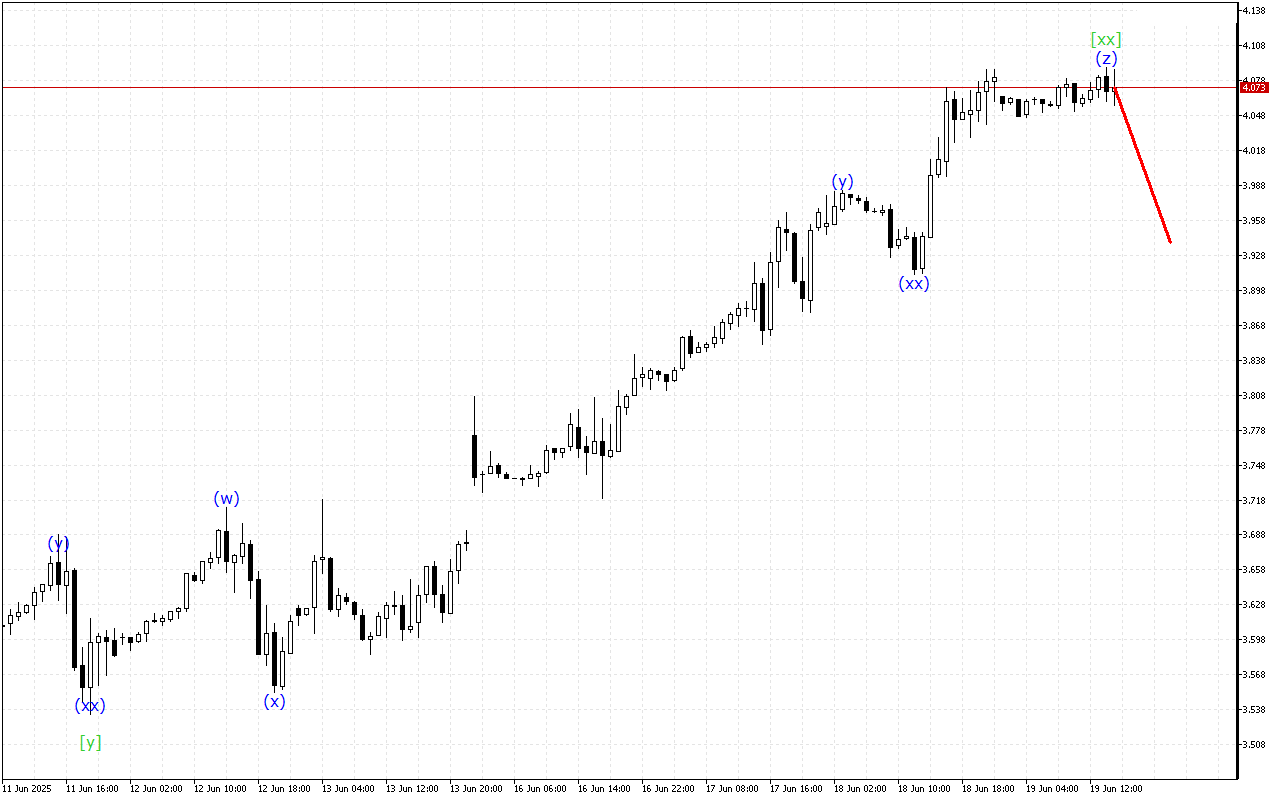
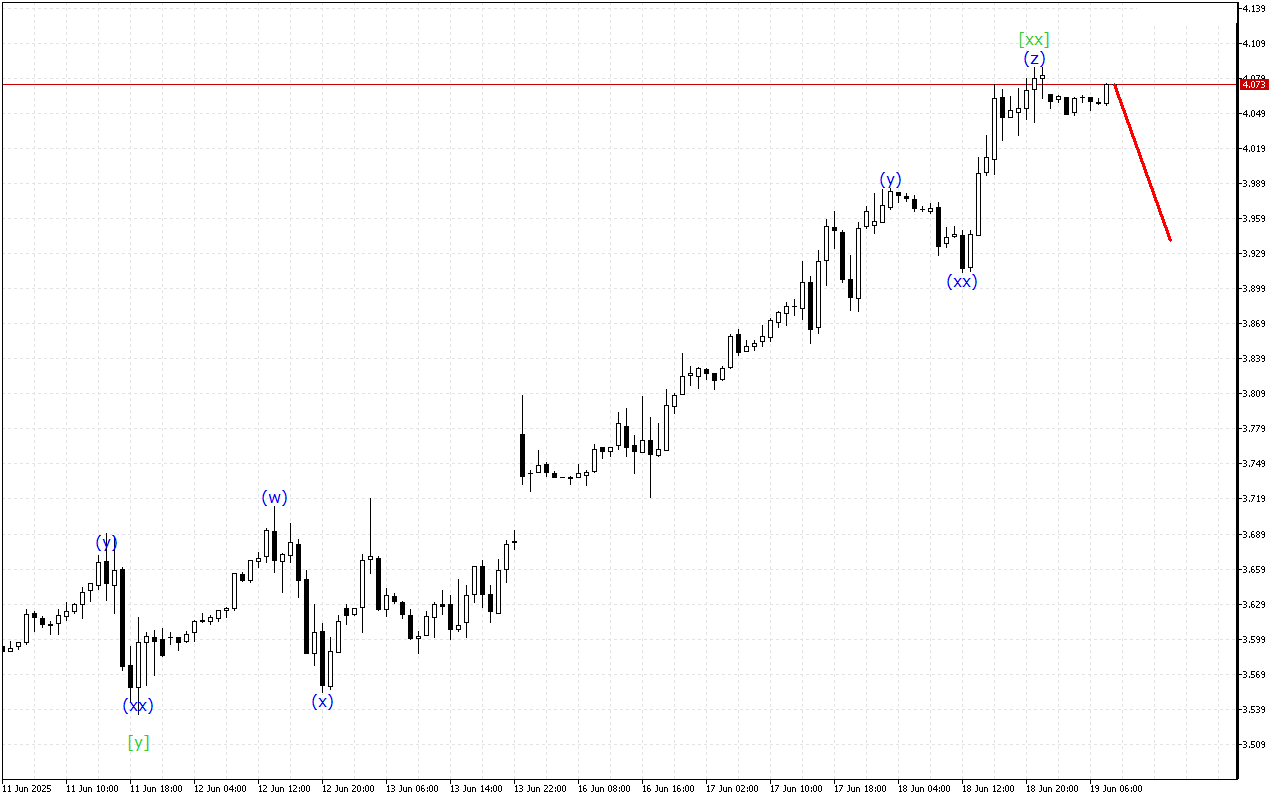
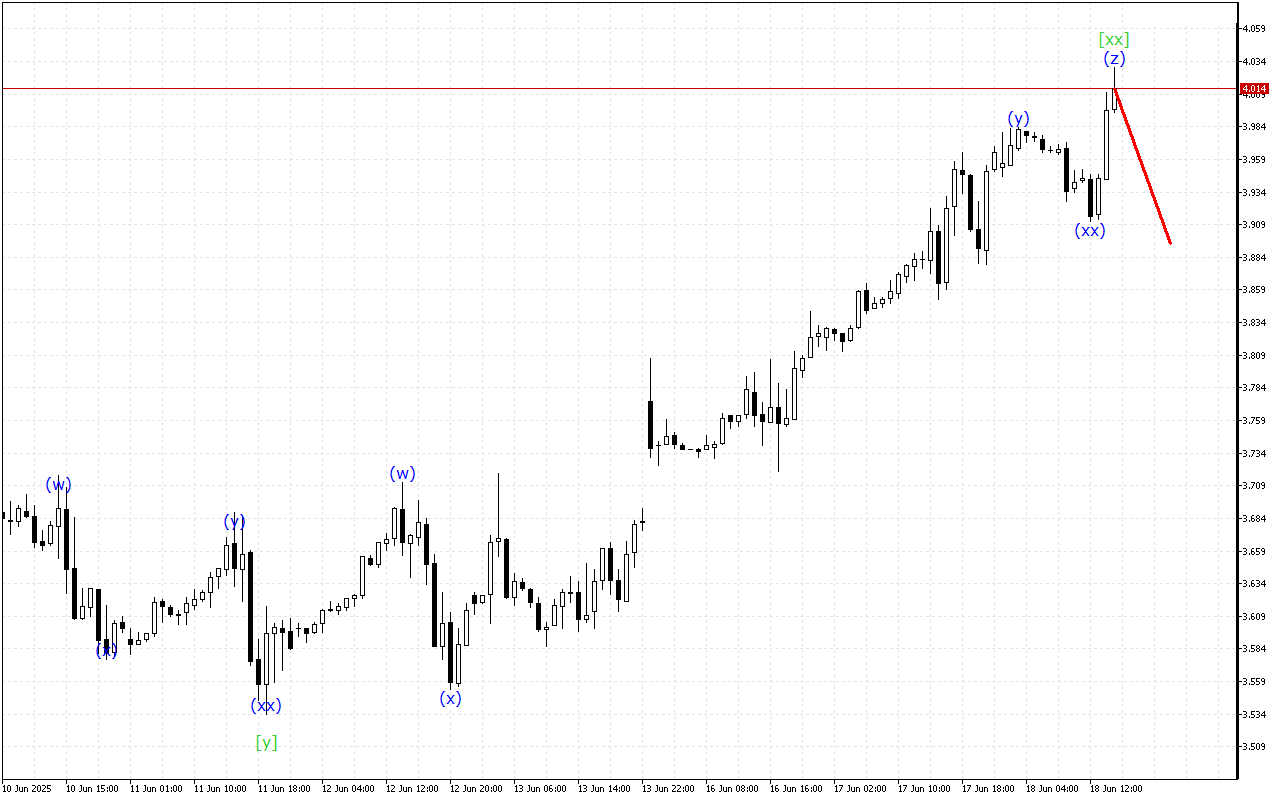
Although the market maintains an upward momentum prevalence, the Natural Gas chart shows signs of a possible end to this…
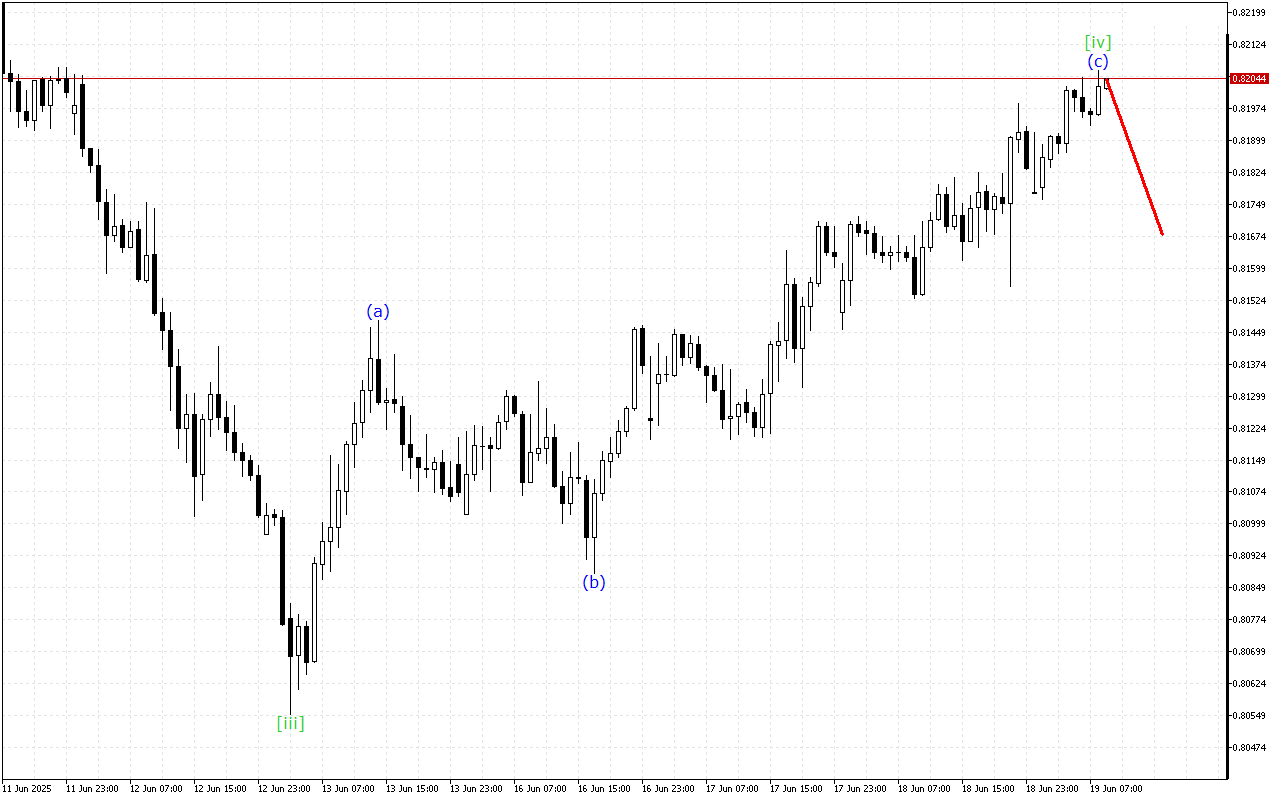
The price continues to move upward, but on the USDCHF chart you can see signs of an impending completion of…
Although the market maintains an upward momentum prevalence, the Natural Gas chart shows signs of a possible end to this…
Although the market continues to move higher, the USDCHF chart is showing some signs of fatigue in the upward momentum.Within…
Although the market maintains an upward momentum prevalence, the Natural Gas chart shows signs of a possible end to this…
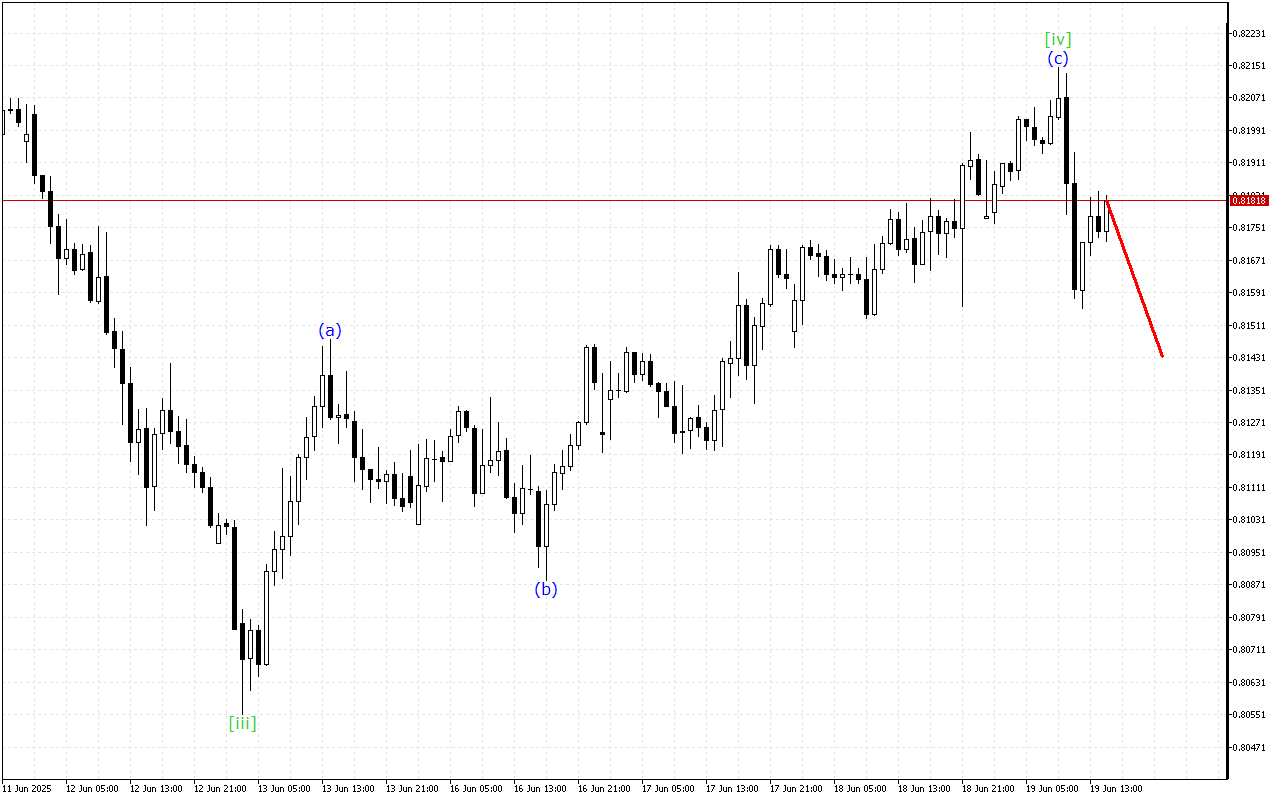
The USDCHF chart shows signals for the end of the upward movement phase.The analysis of the higher degree wave structure…
Although the market maintains an upward momentum prevalence, the Natural Gas chart shows signs of a possible end to this…
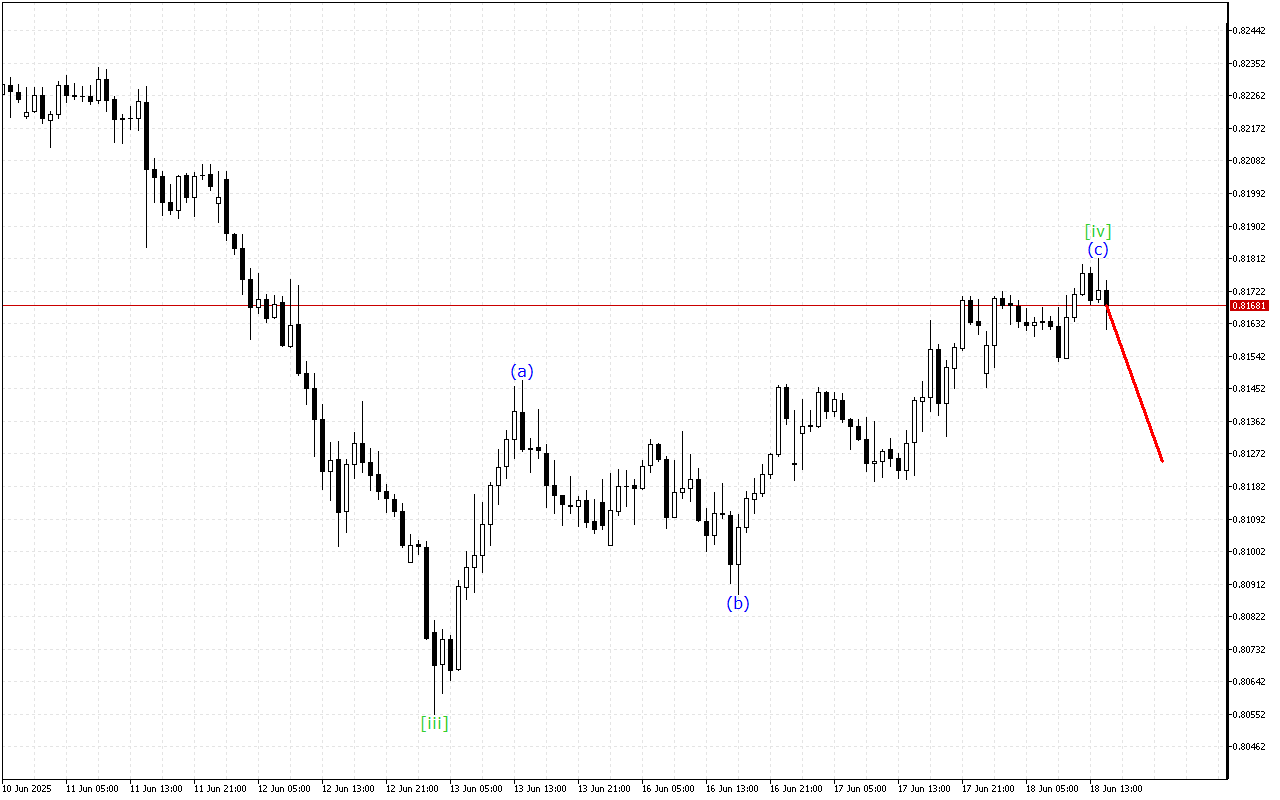
Although the market maintains an upward momentum prevalence, the USDCHF chart shows signs of a possible end to this trend.The…
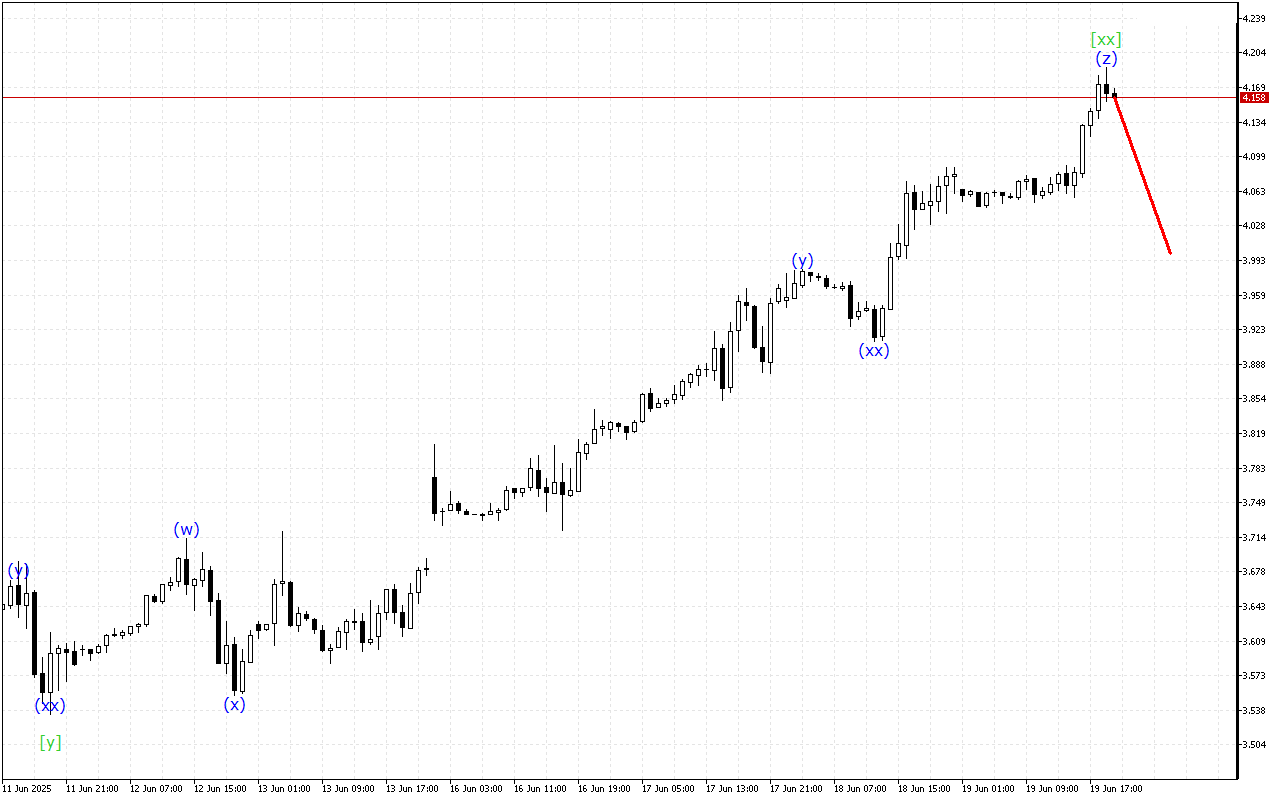
The Natural Gas chart shows signals for the end of the upward movement phase.The current dynamics of the movement indicate…