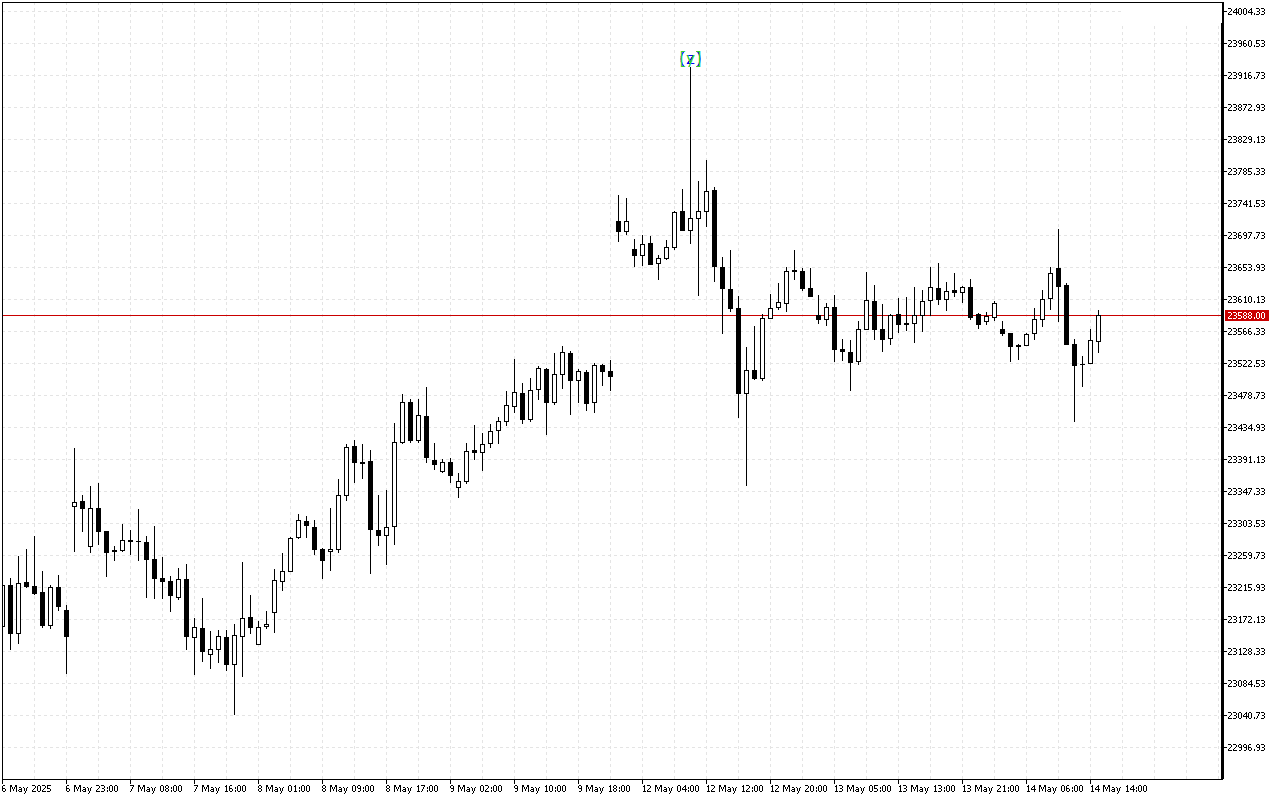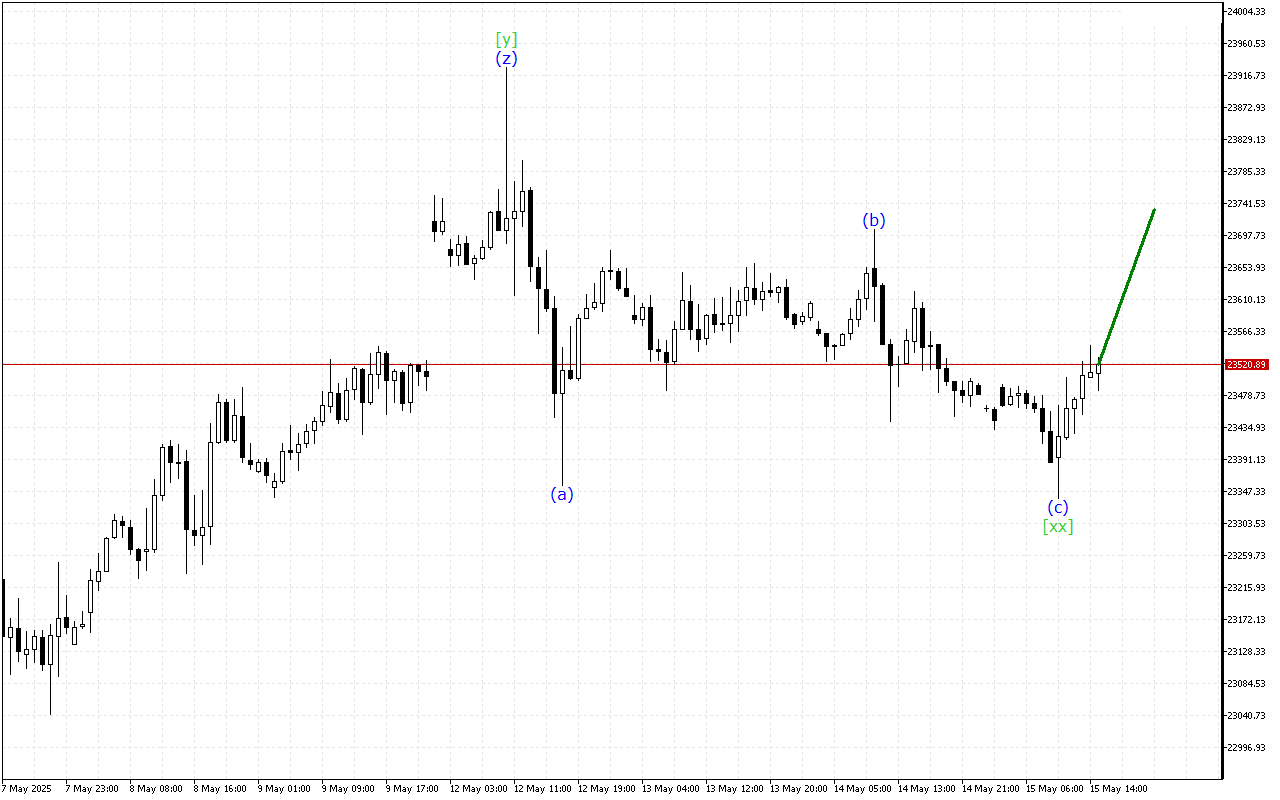
DAX 40 H1: Wave Analysis for the American Session on 15.5.2025
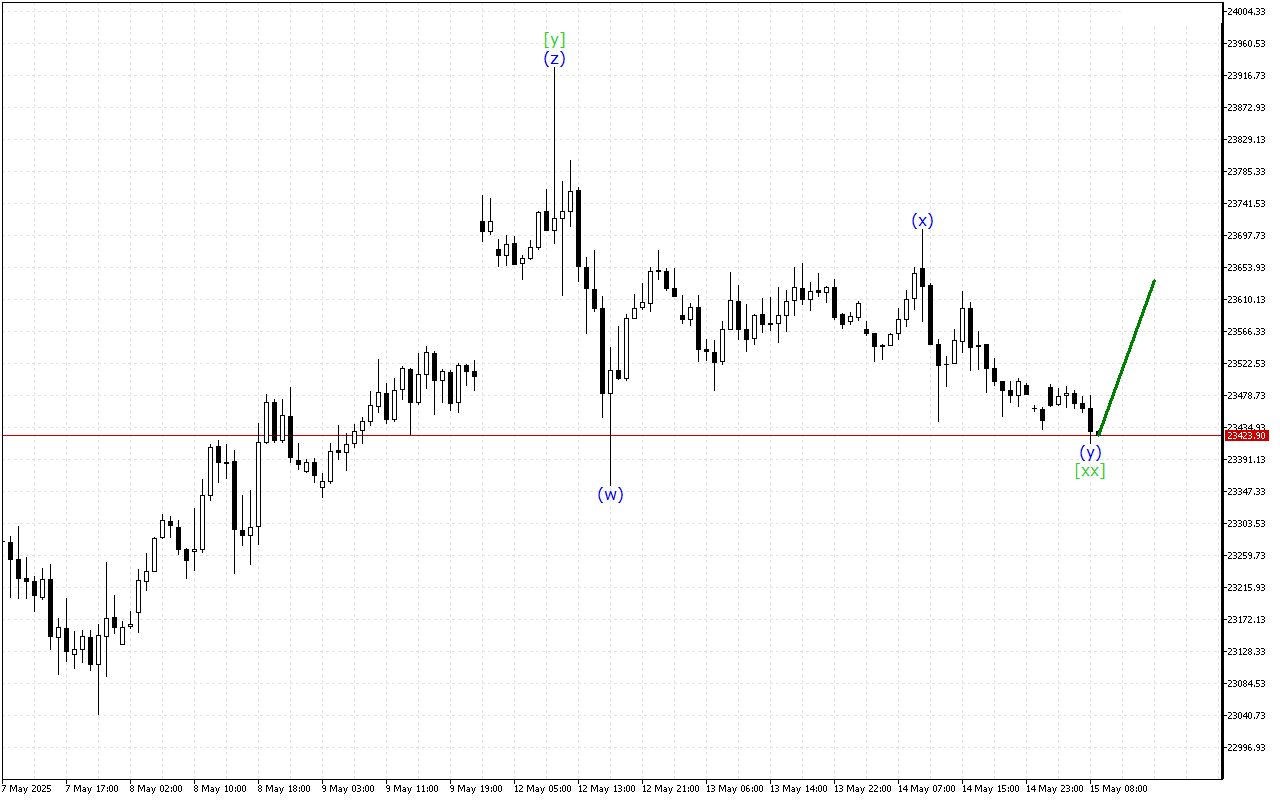
Despite the decline, there are signals on the DAX 40 chart indicating a possible upcoming change in direction.The medium-term movement…
Despite the decline, there are signals on the DAX 40 chart indicating a possible upcoming change in direction.The medium-term movement…
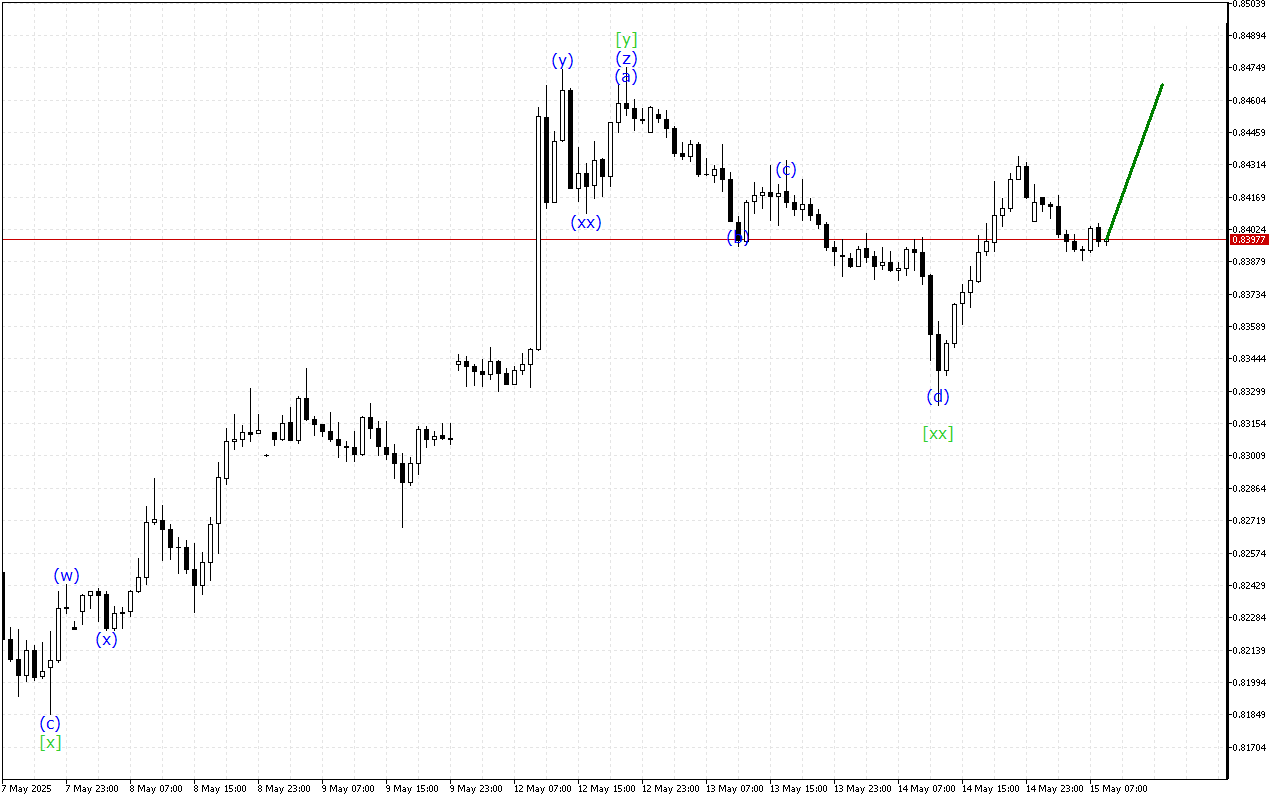
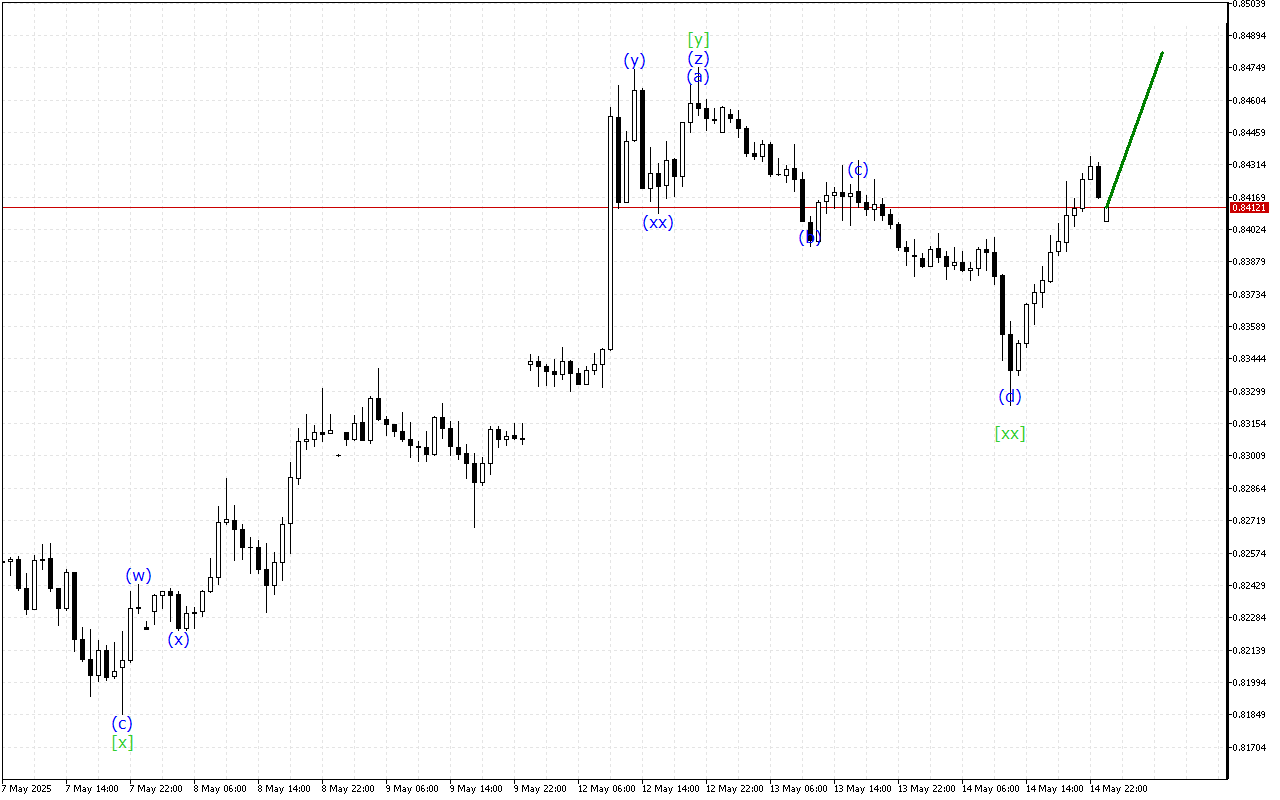
Despite the decline, there are signals on the USDCHF chart indicating a possible upcoming change in direction.The medium-term movement vector…
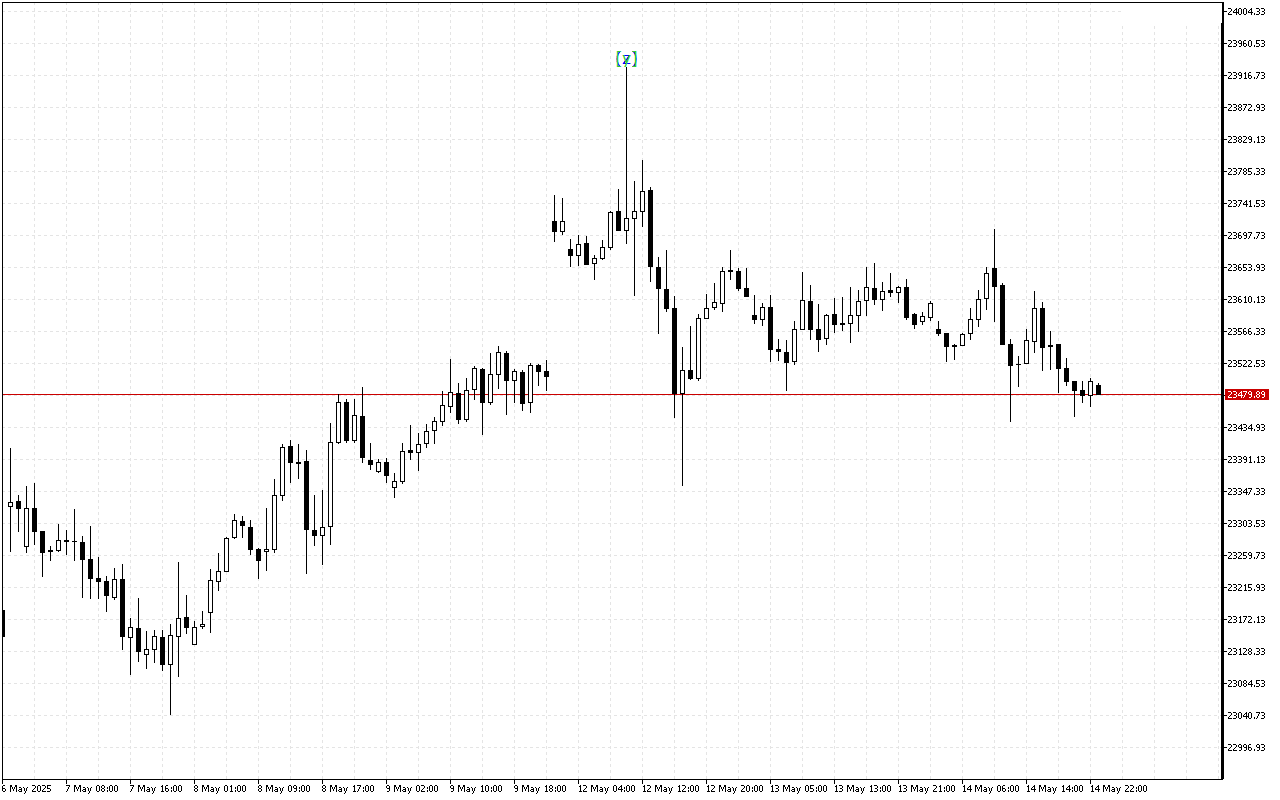
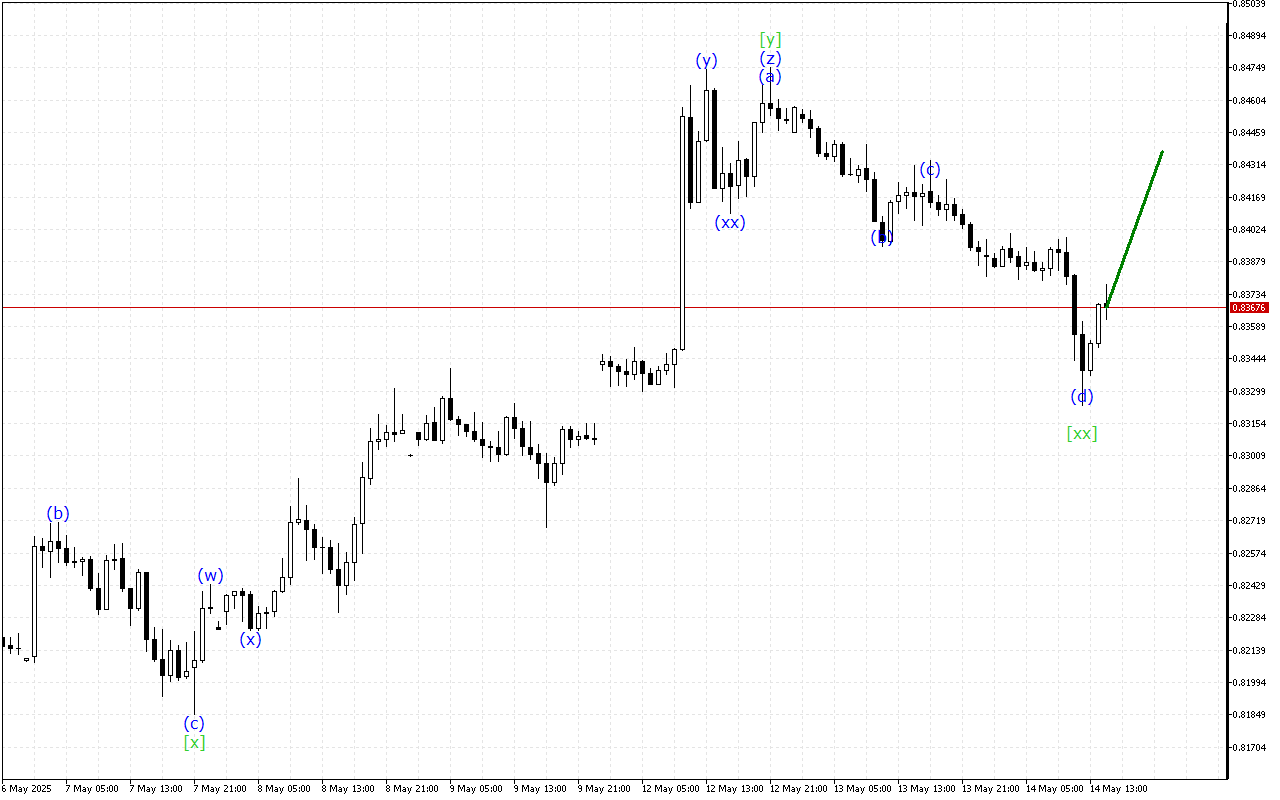
The market remains in a downtrend, though wave analysis indicates a potential end to the current trend.The medium-term movement vector…
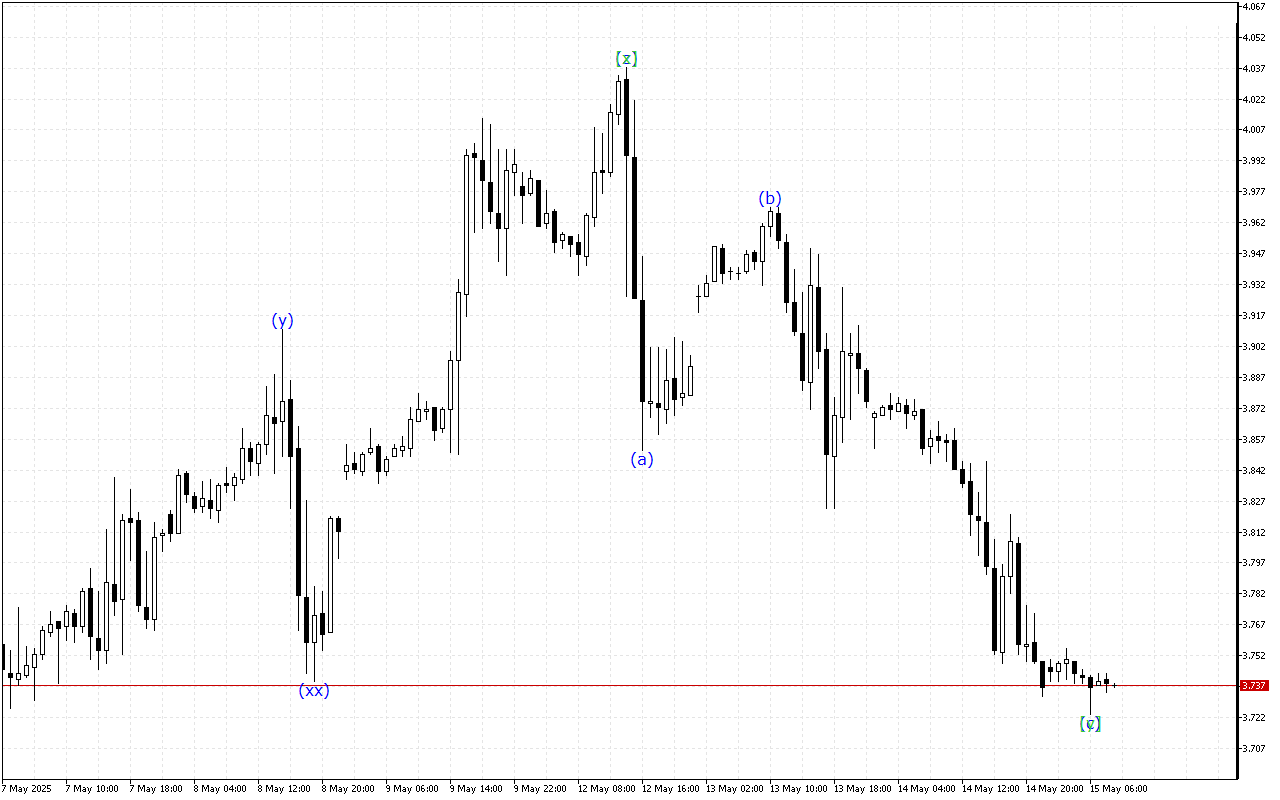
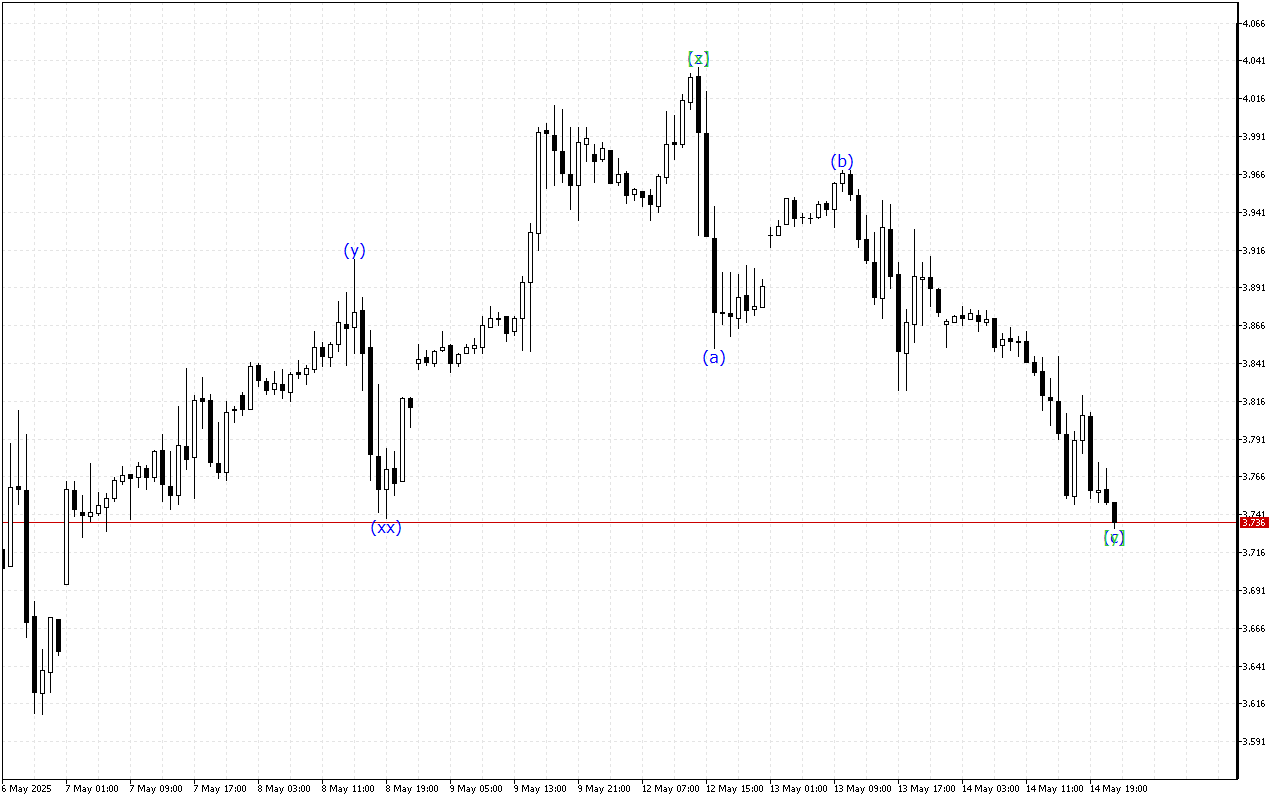
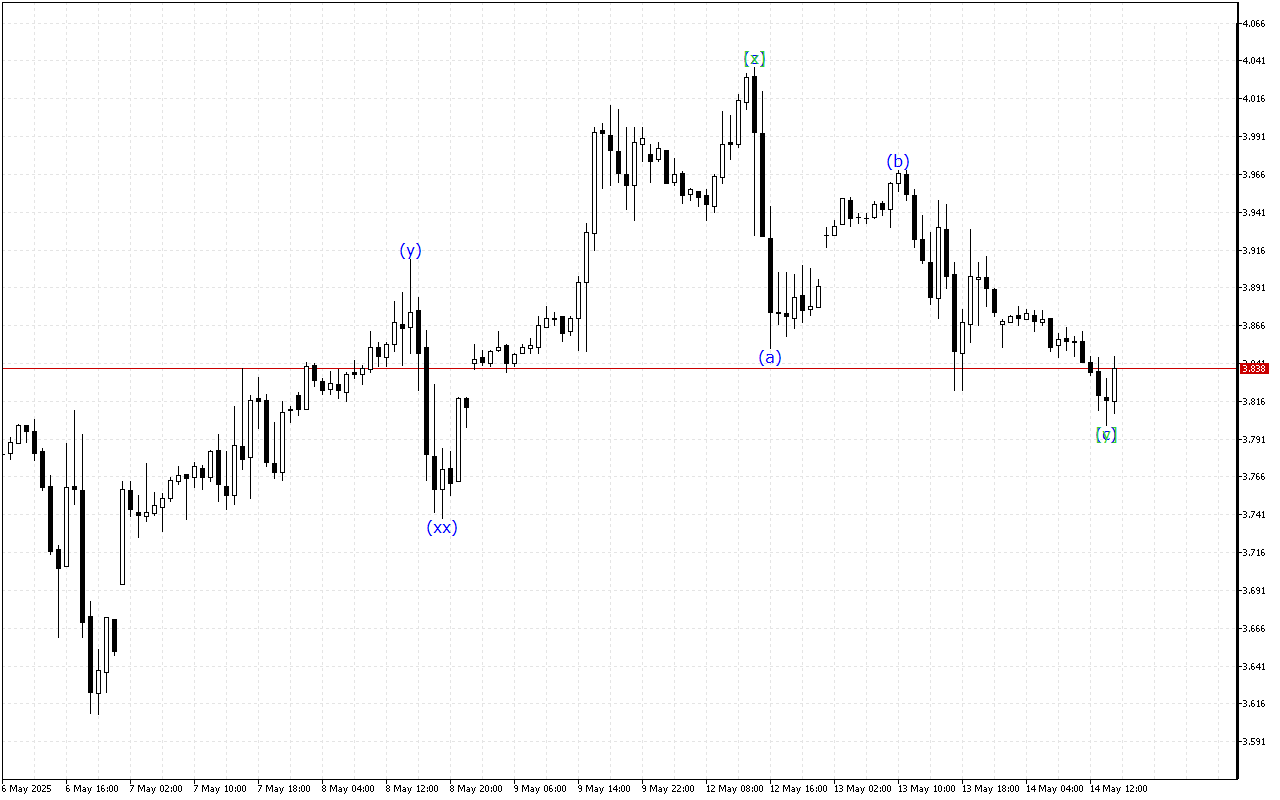
The Natural Gas chart shows the continuation of mixed trading dynamics, reflecting the general uncertainty on the market.An analysis of…
The DAX 40 chart shows mixed trading dynamics, with periods of both positive and negative price activity.The wave structure of…
The Natural Gas chart shows mixed trading dynamics, with periods of both positive and negative price activity.The current wave structure…
The market is still heading down, but the chart shows signs that the current trend will end soon.USDCHF continues to…
The market is still heading down, but the chart shows signs that the current trend will end soon.The medium-term movement…
The DAX 40 chart shows the continuation of mixed trading dynamics, reflecting the general uncertainty on the market.The wave structure…
The nature of the price movement on the Natural Gas chart remains mixed. The tool predominantly maintains the sideways direction.The…