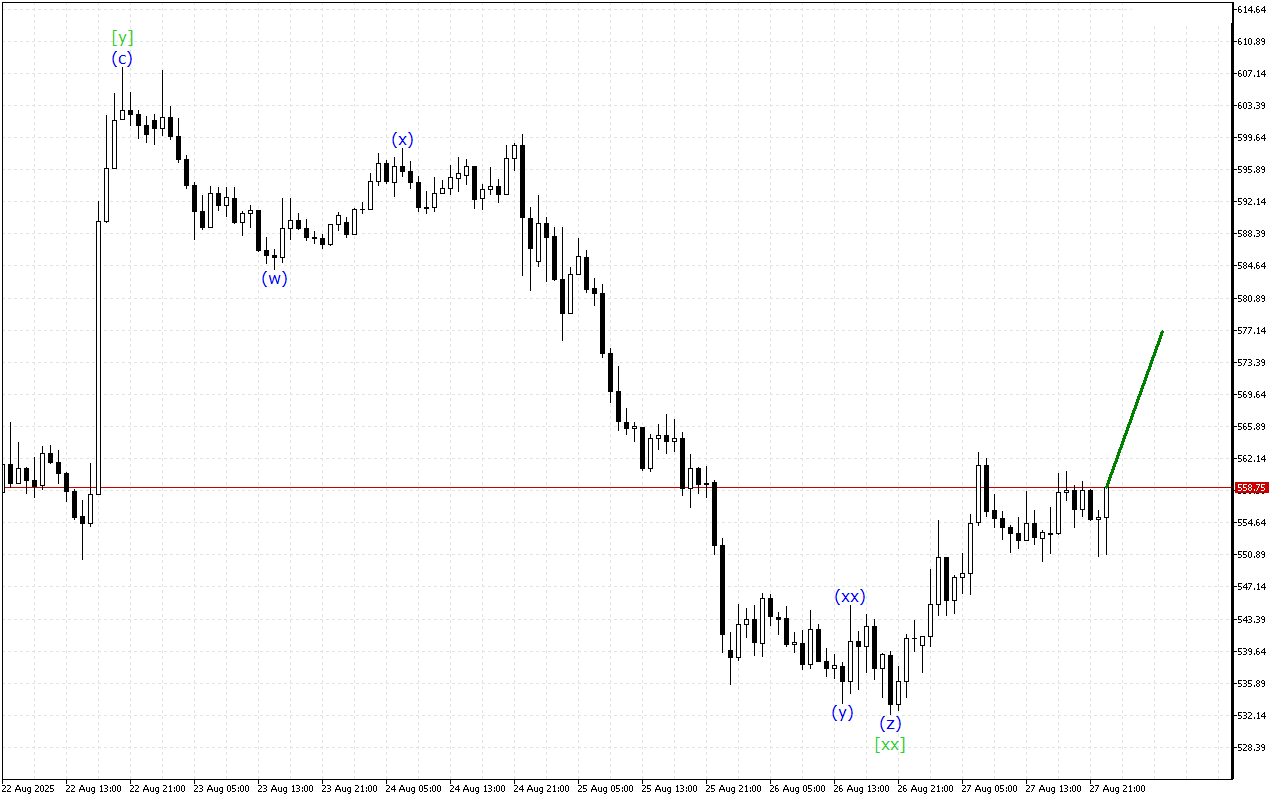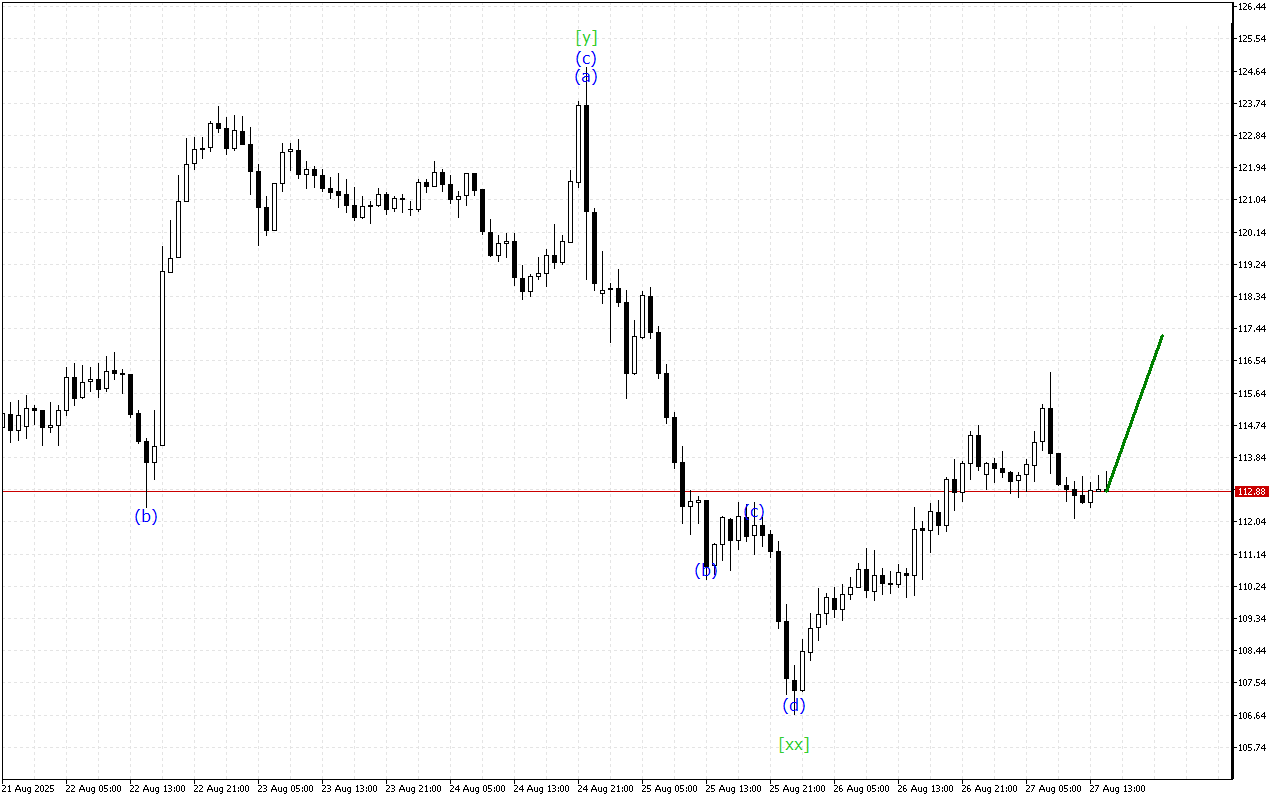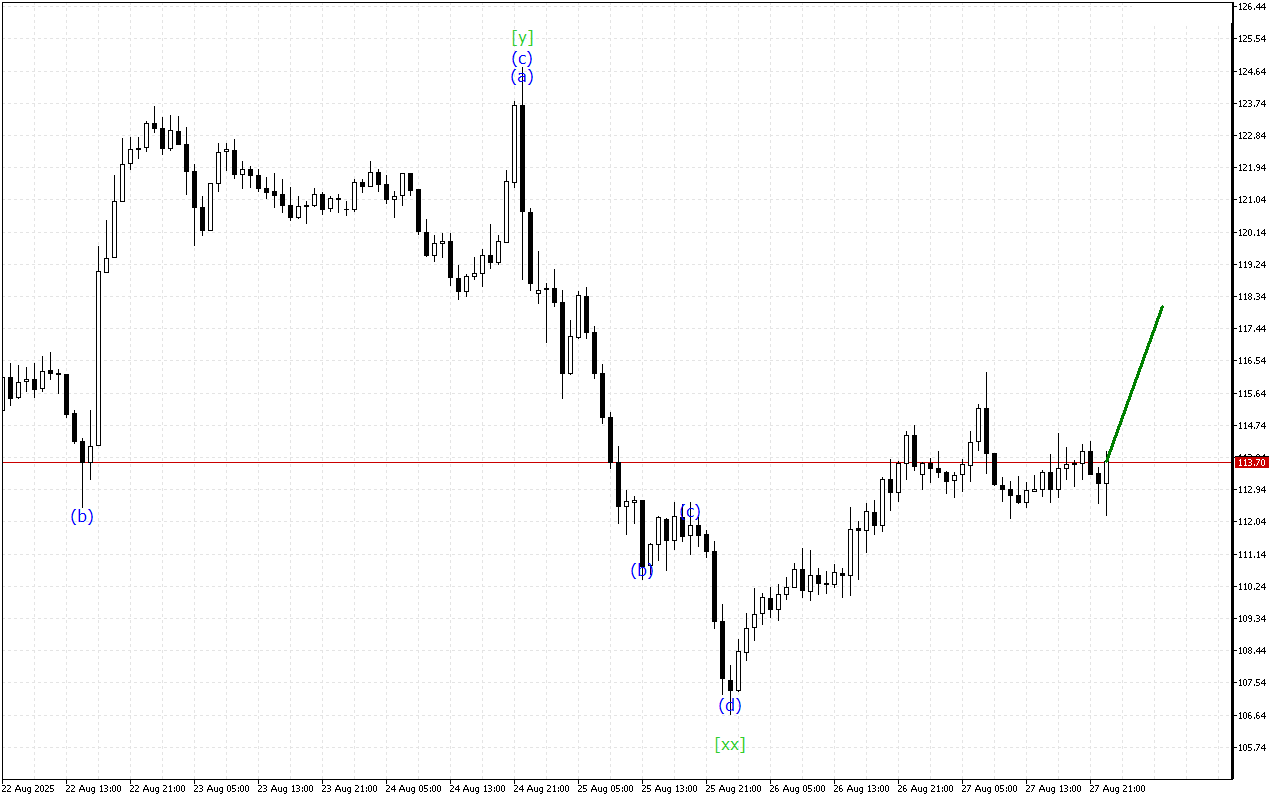
Litecoin H1: Wave Analysis for the Asian Session on 28.8.2025
Despite the decline, there are signals on the Litecoin chart indicating a possible upcoming change in direction.The medium-term movement vector…
Despite the decline, there are signals on the Litecoin chart indicating a possible upcoming change in direction.The medium-term movement vector…
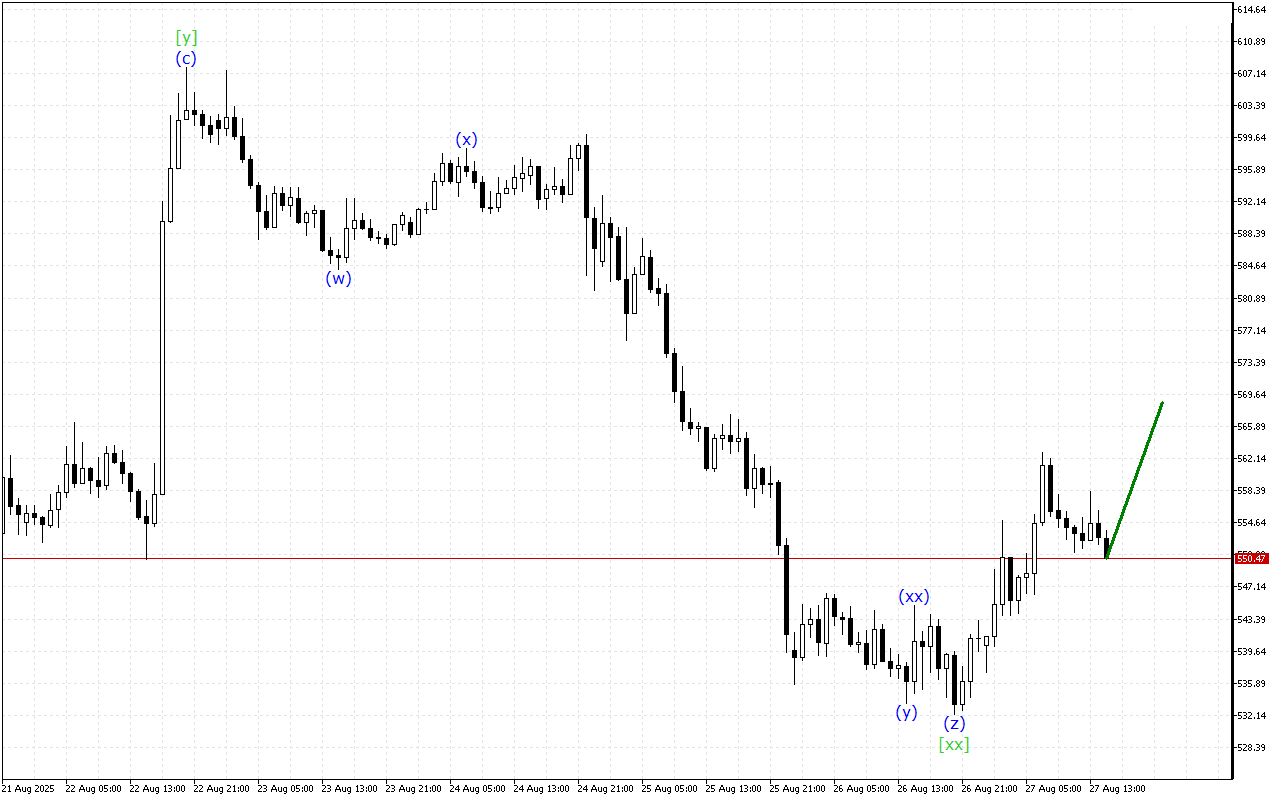
Despite the steady decline in price, the Bit.Cash chart is giving signals about a possible completion of the current bearish…
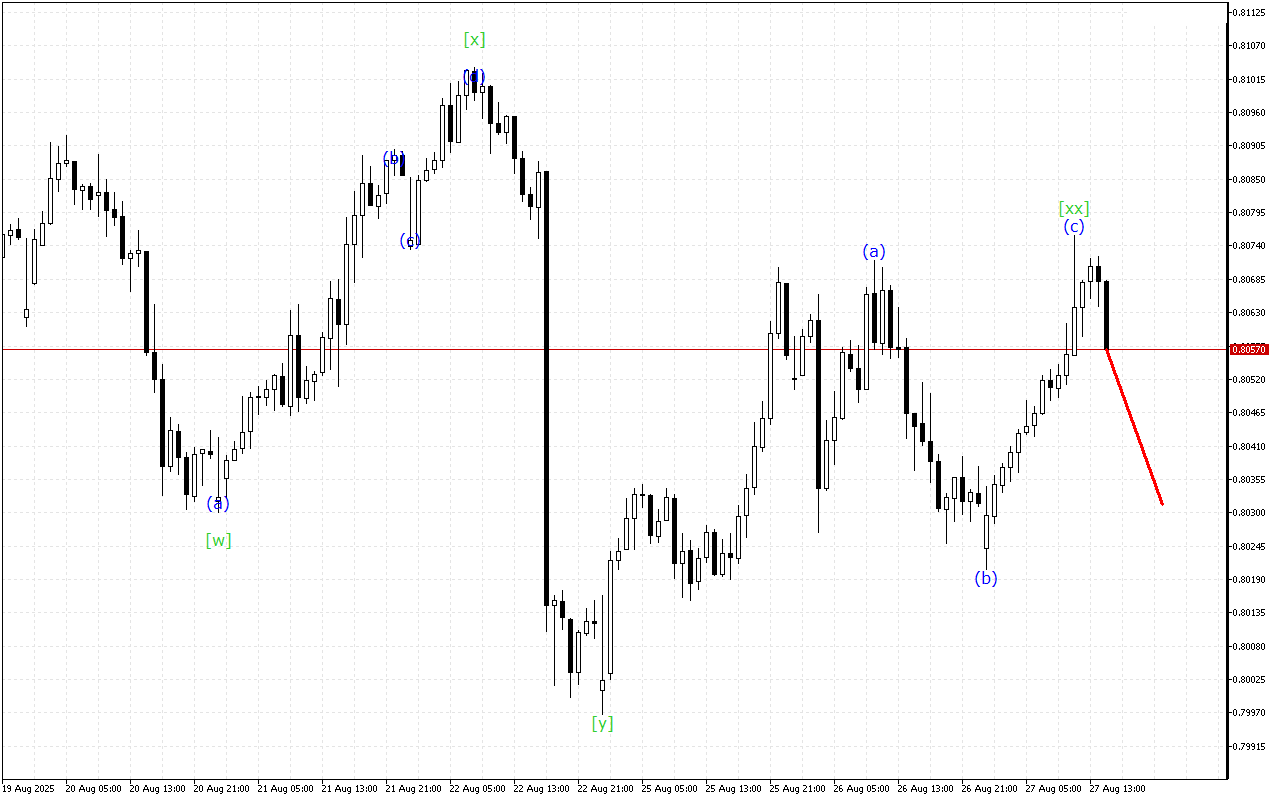
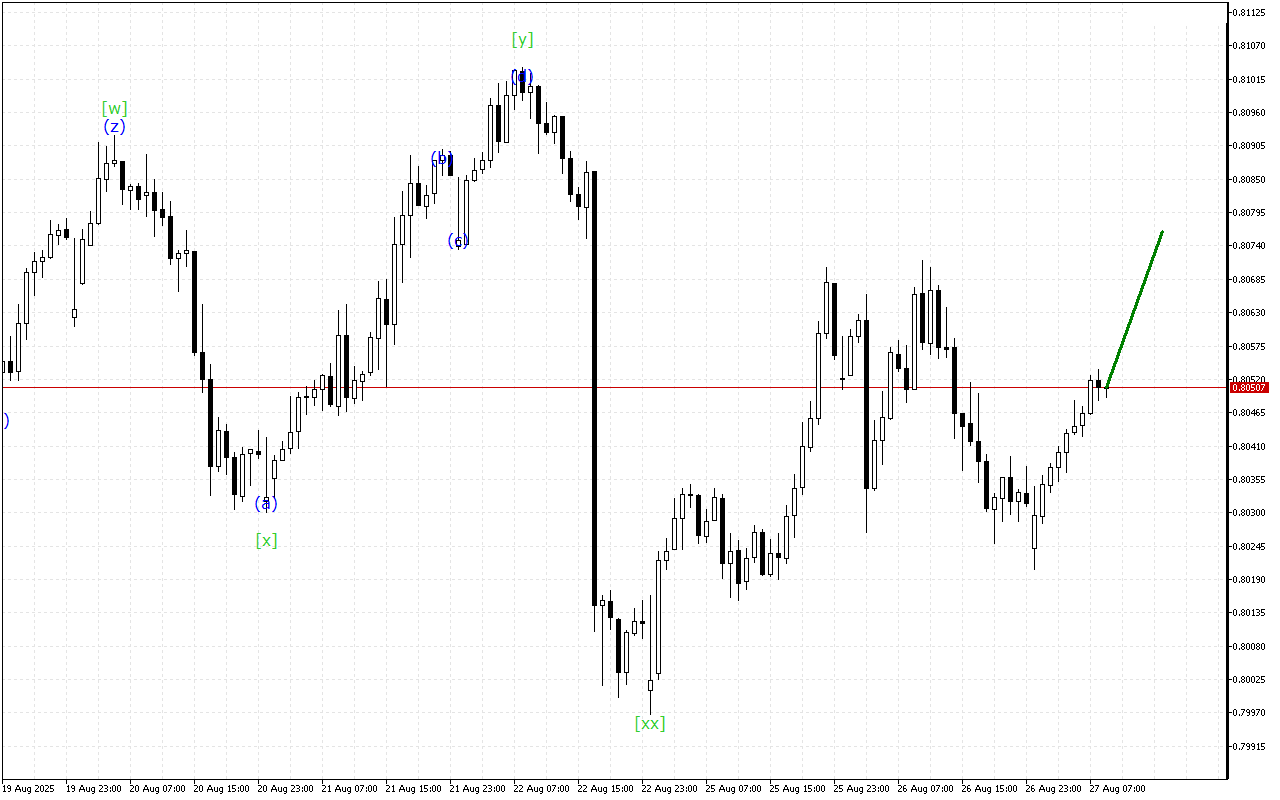
Although the market maintains an upward momentum prevalence, the USDCHF chart shows signs of a possible end to this trend.The…
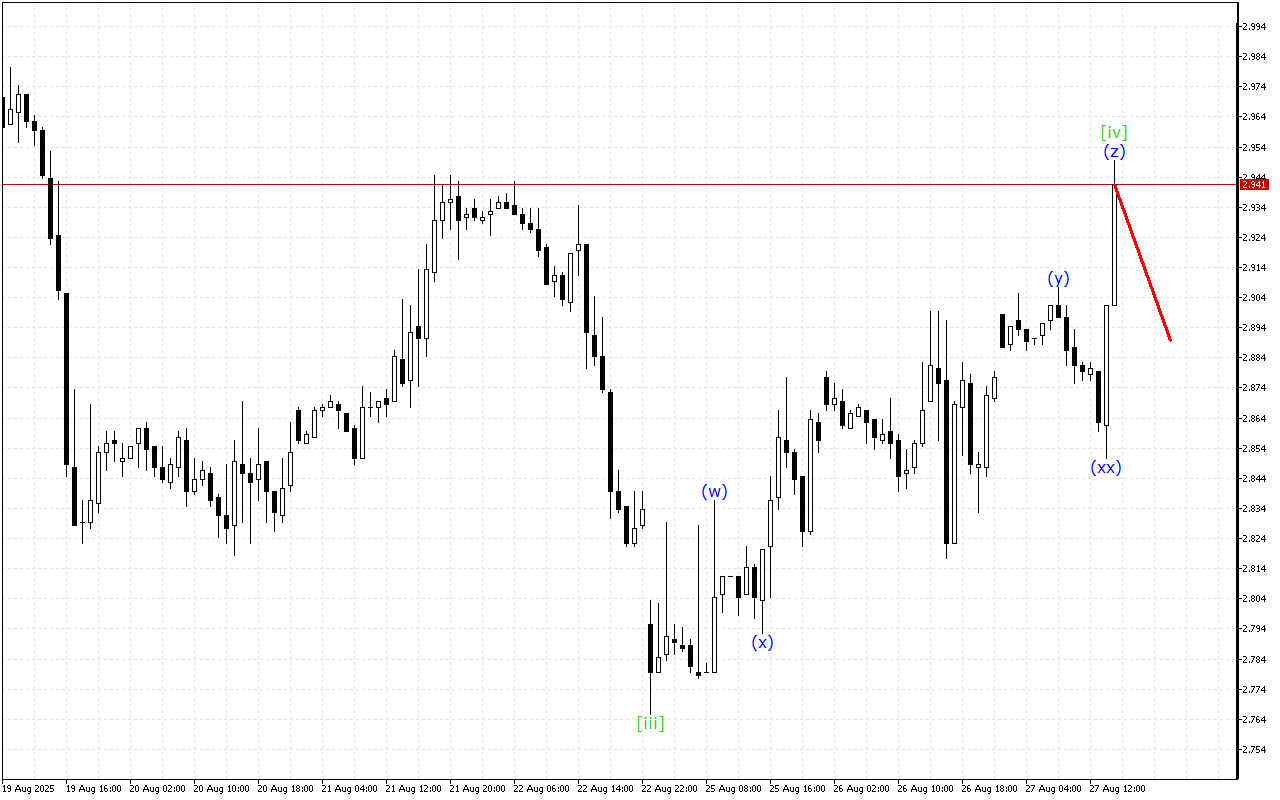
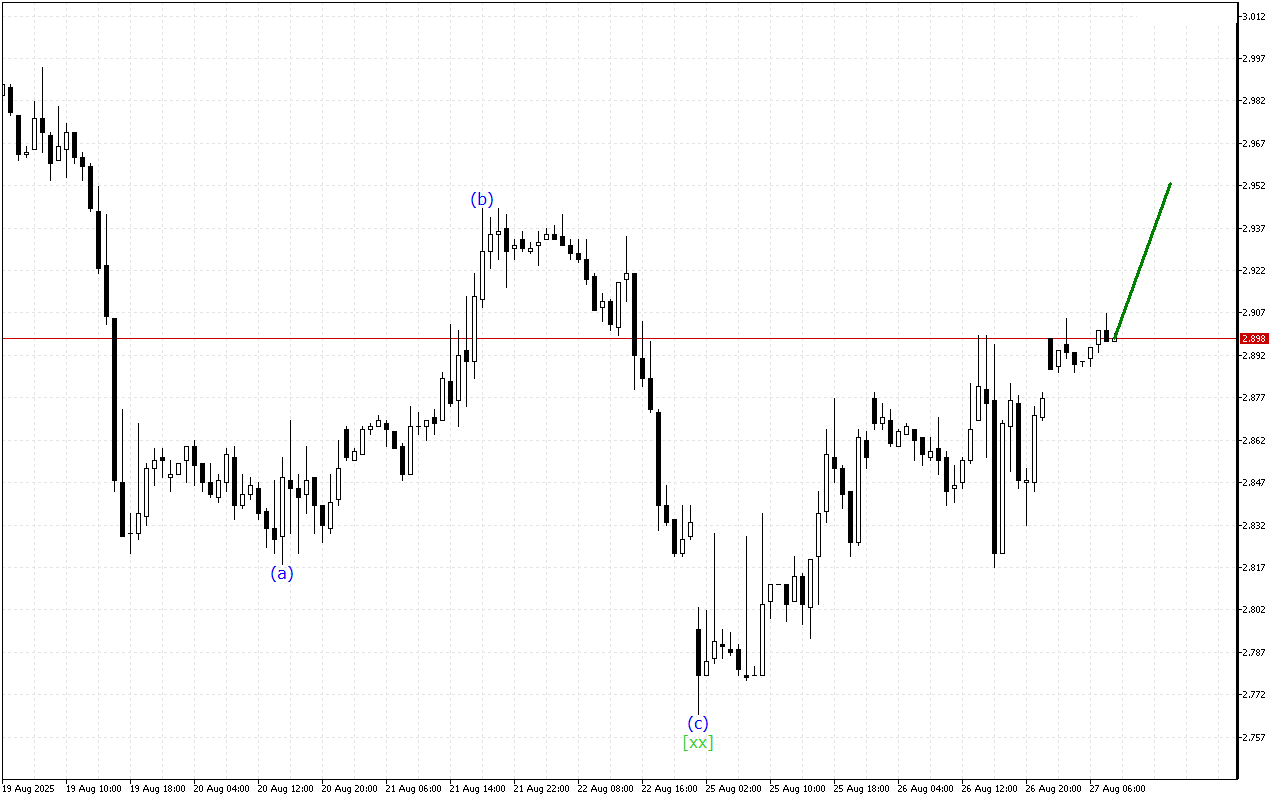
Although the market maintains an upward momentum prevalence, the Natural Gas chart shows signs of a possible end to this…
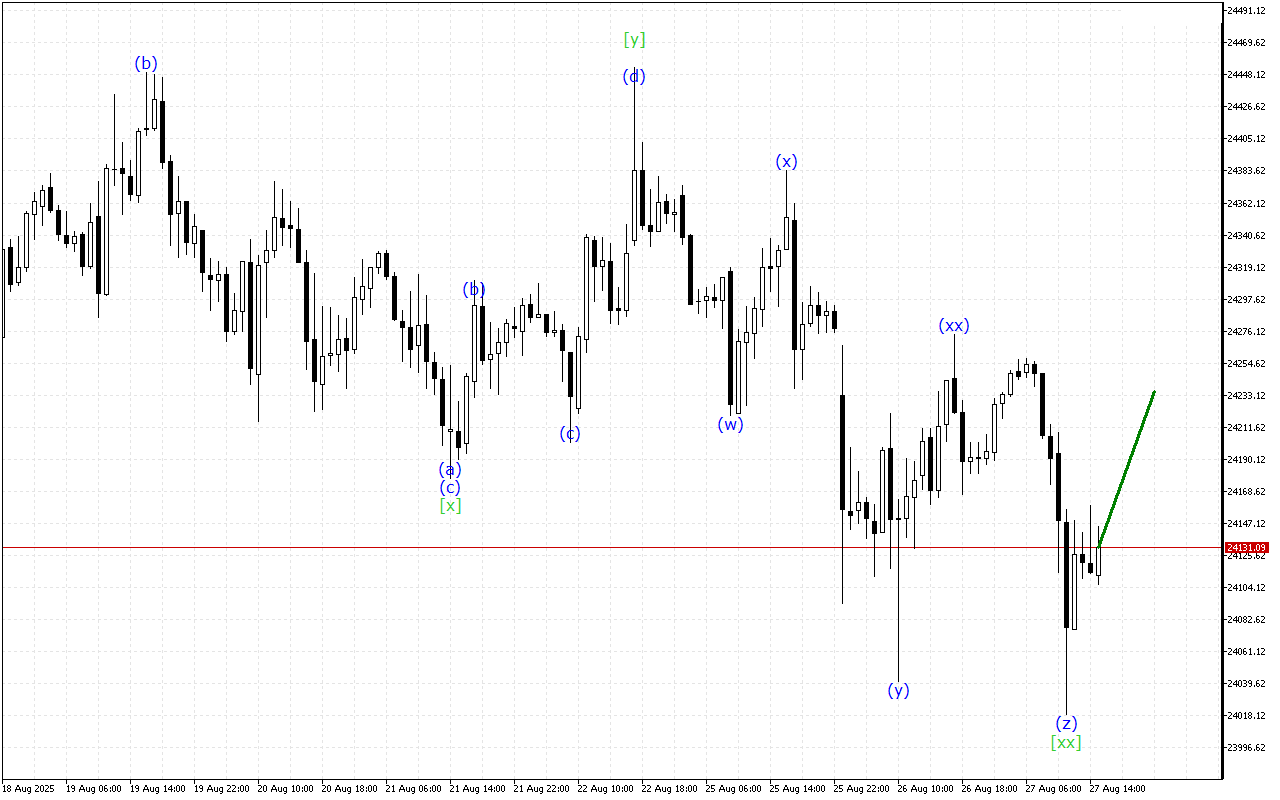
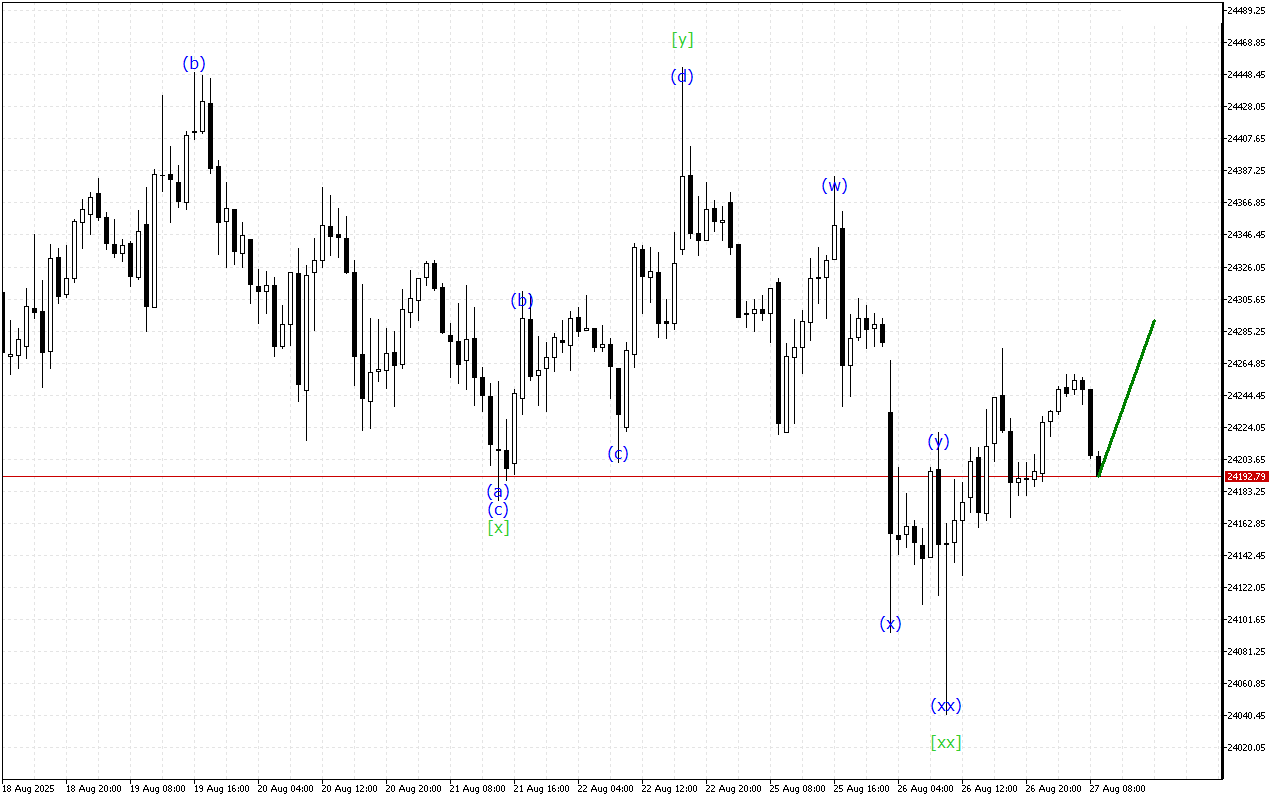
The market remains in a downtrend, though wave analysis indicates a potential end to the current trend.DAX 40 continues to…
The market remains in a downtrend, though wave analysis indicates a potential end to the current trend.The medium-term movement vector…
Despite the decline, there are signals on the Bit.Cash chart indicating a possible upcoming change in direction.The medium-term movement vector…
The market is still heading down, but the chart shows signs that the current trend will end soon.The medium-term movement…
The market is still heading down, but the chart shows signs that the current trend will end soon.The medium-term movement…
Despite the steady decline in price, the DAX 40 chart is giving signals about a possible completion of the current…