The Natural Gas chart shows mixed trading dynamics, with periods of both positive and negative price activity.
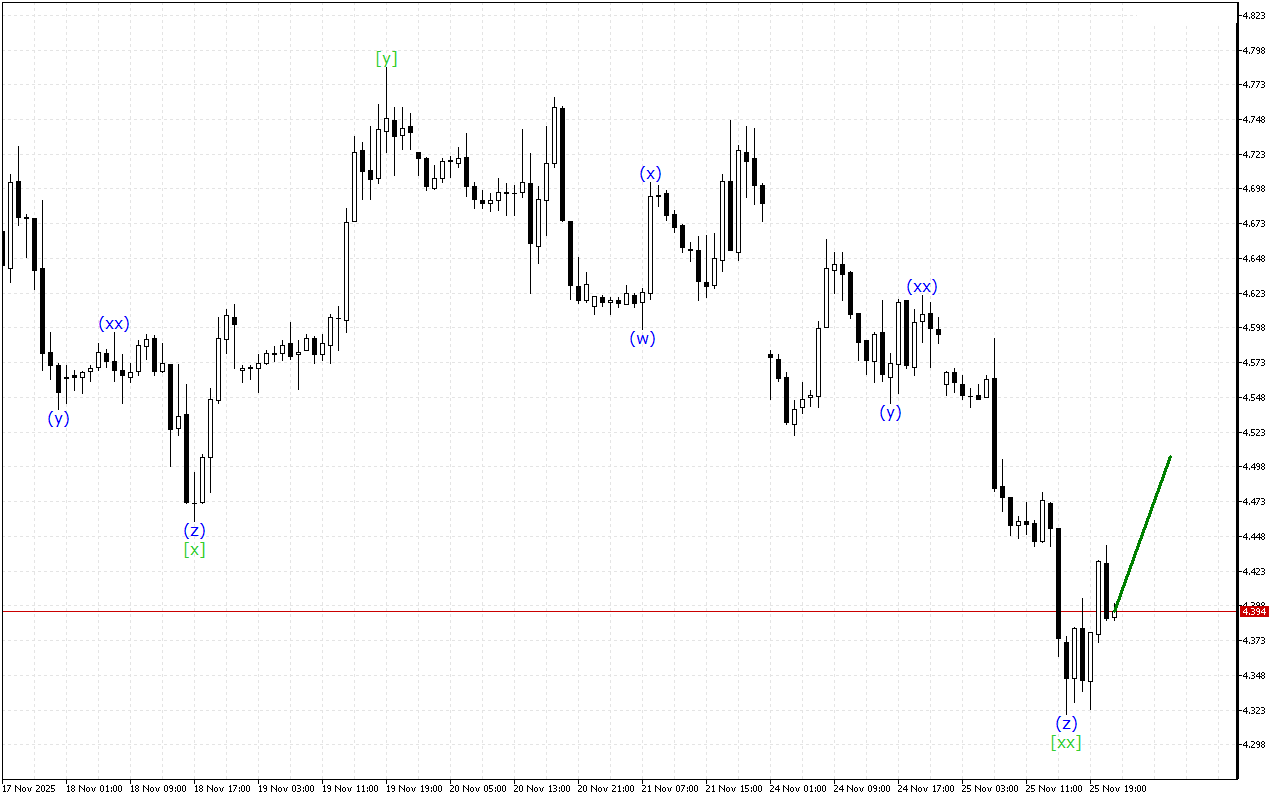
The wave structure of a higher-degree is a correctional area. Now the formation of the final wave [y] is seen. After its completion, the further direction of movement can be determined in the market or the development of a five-wave structure will be seen.
Within a lower-degree wave structure, the development of a triple three is noted. The formation of the wave (z) is being completed in this structure. Against this background, the completion of correction and the beginning of a more directional movement are expected.
Analysis shows that the market dynamics are characterized by mixed signals over a longer distance. In such conditions, it is worth waiting for the current wave to complete its formation.
In the current situation, it’s wise to hold off on making any trading decisions.
Natural Gas H1: Wave Analysis for the American Session on 12.5.2025