The Natural Gas chart shows mixed dynamics, which indicates overall uncertainty and hints at a pause in decision-making.
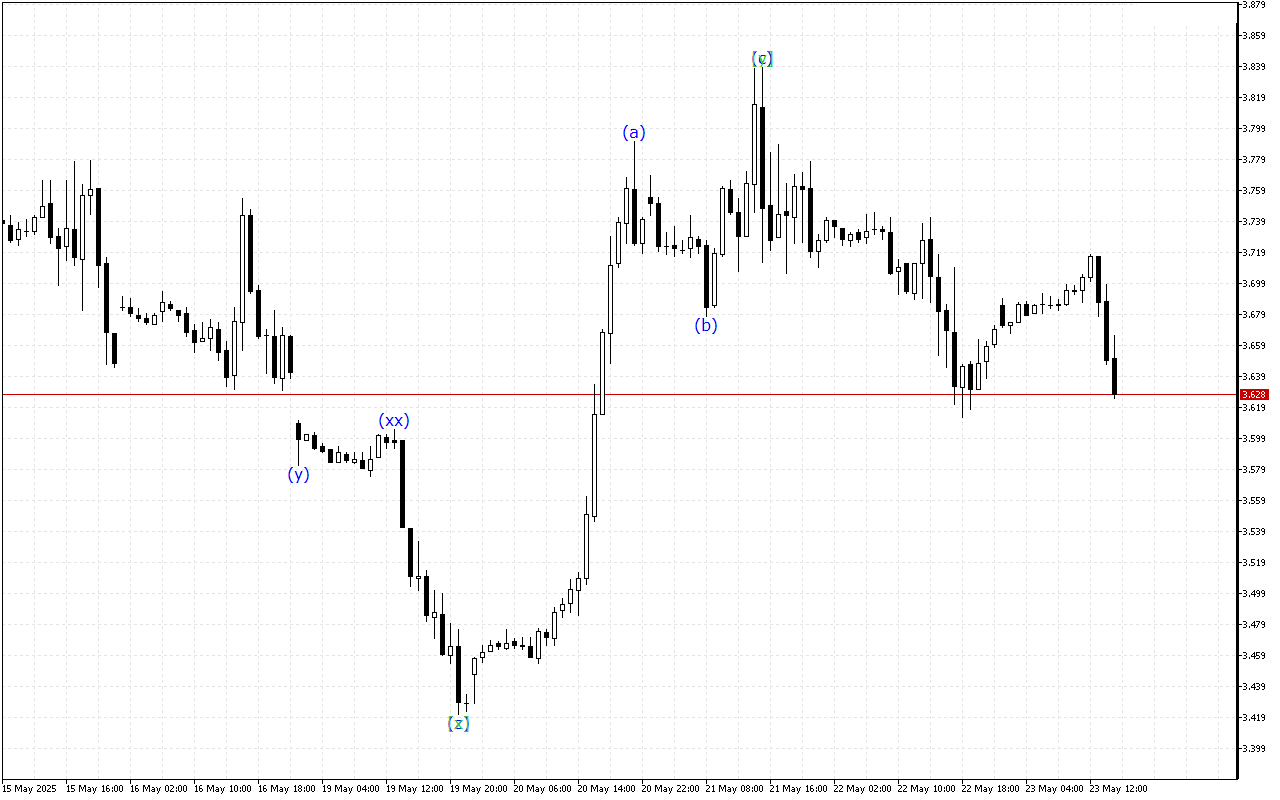
The wave structure of a higher-degree is a correctional area. Now the formation of the final wave [y] is seen. After its completion, the further direction of movement can be determined in the market or the development of a five-wave structure will be seen.
In the context of the lower-degree wave structure, the formation of the ABC zigzag is clearly seen. Once the wave (c) is fully formed, a resumption of the trend movement may be observed.
Analysis shows that the market dynamics are characterized by mixed signals over a longer distance. In such conditions, it is worth waiting for the current wave to complete its formation.
In the current situation, it’s wise to hold off on making any trading decisions.
Natural Gas H1: Wave Analysis for the American Session on 23.5.2025