The price continues to move down, but the Natural Gas chart shows signs that the downward momentum is likely to end soon.
At a higher time interval, an ascending wedge continues to form. A downward corrective wave [iv] has been formed in this movement by this moment. Once this wave is completed, the formation of an upward wave [v] should be seen.
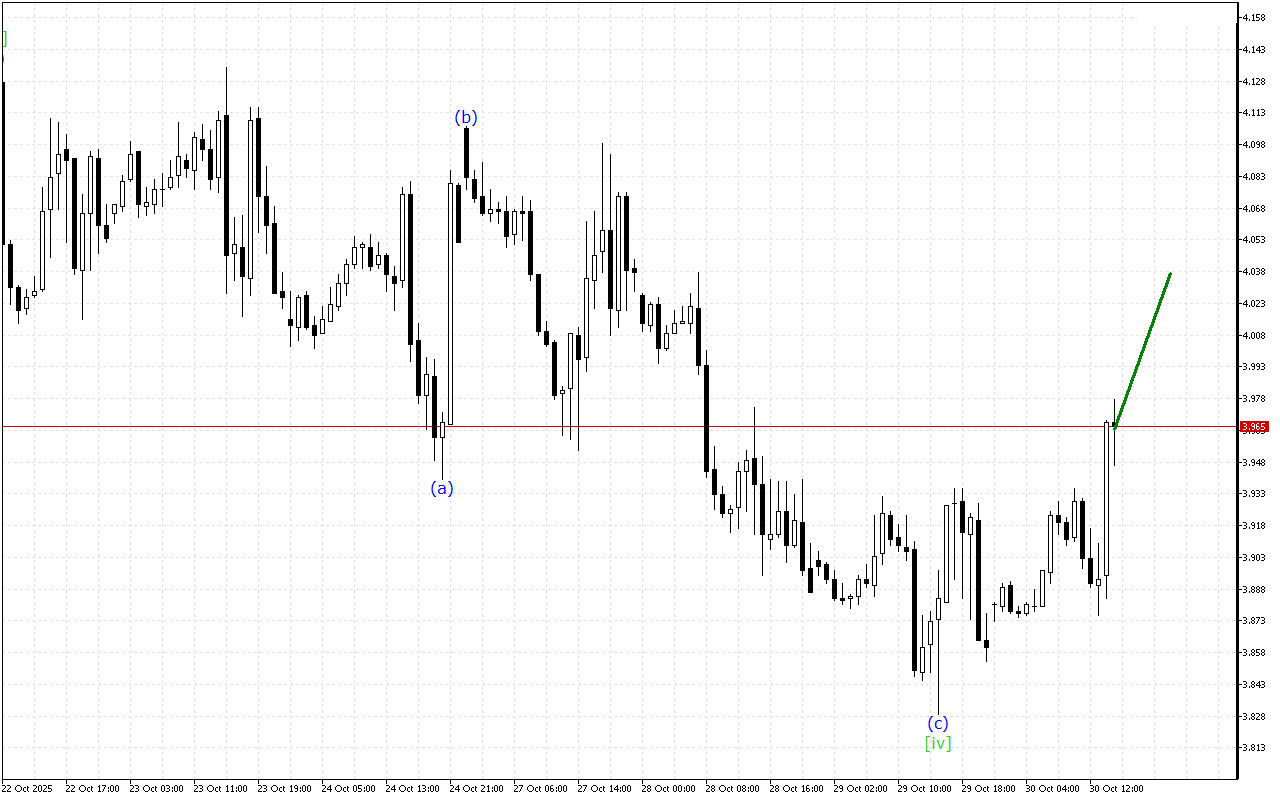
According to a smaller time-frame, the market moves within the ABC zigzag. Currently, the price is completing the formation of the wave (c) apparently and the price movement may move into a new wave formation.
To summarize, at the moment the Natural Gas chart is maintaining a downward movement vector. However, the corrective wave is in the final stage of formation.
In this situation, long positions are prioritized.
Natural Gas H1: Wave Analysis for the American Session on 30.10.2025