The Natural Gas chart shows the continuation of mixed trading dynamics, reflecting the general uncertainty on the market.
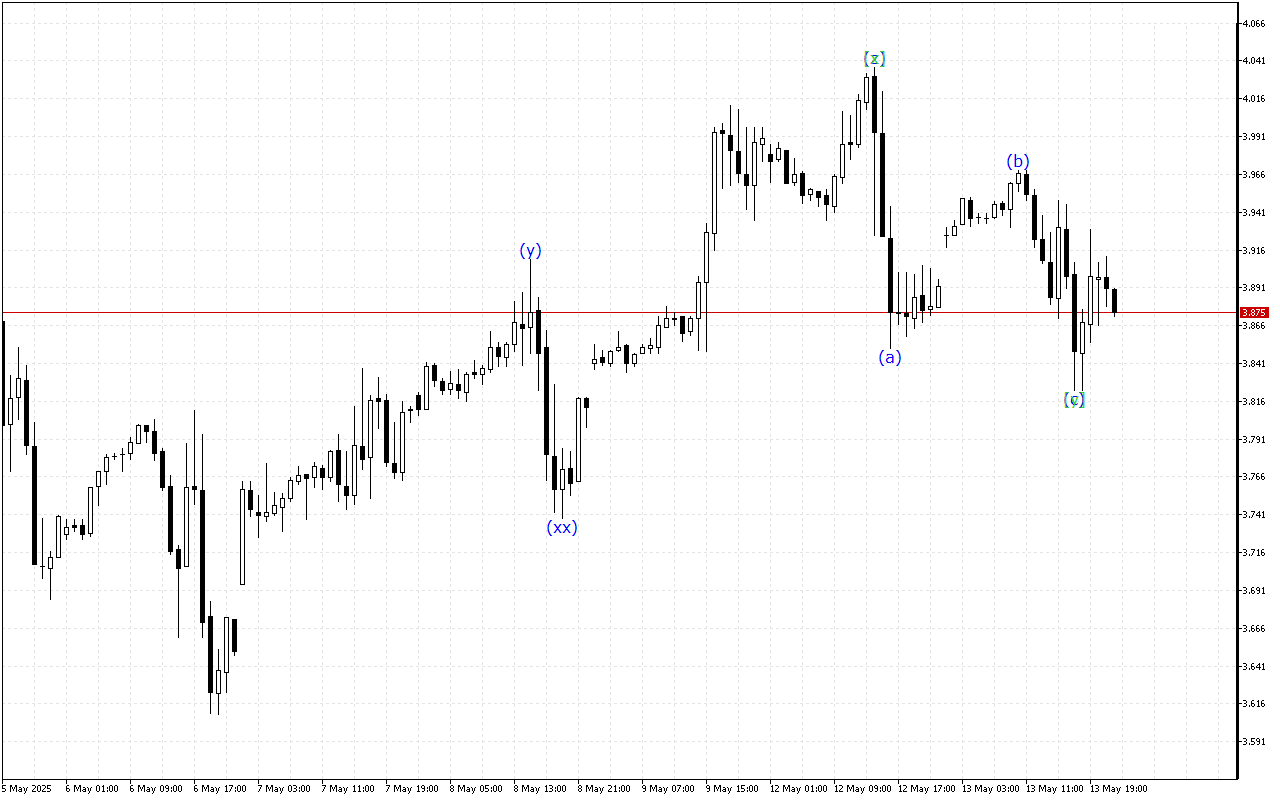
The current wave structure is hinting at the formation of a WXY double three where there is the final wave [y].
According to a smaller time-frame, the market moves within the ABC zigzag. Currently, the price is completing the formation of the wave (c) apparently and the price movement may move into a new wave formation.
To summarize, it can be noted that the market shows mixed dynamics over a longer period. In this situation, it is worth waiting for the current wave to complete its formation.
In the current environment, it’s advisable to avoid making significant trading moves.
Natural Gas H1: Wave Analysis for the Asian Session on 14.5.2025