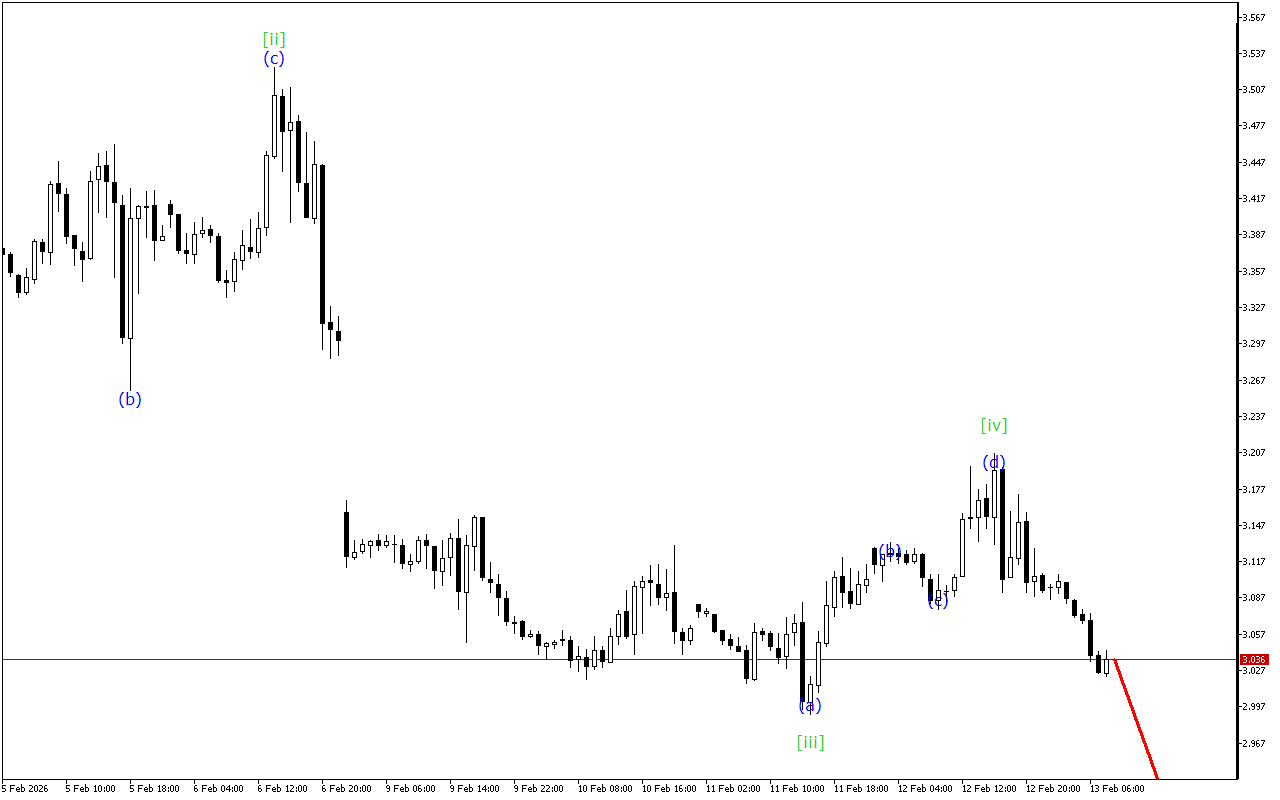
The Natural Gas chart shows signals for the end of the upward movement phase.
Within the higher time interval, the formation of a descending wedge can be seen. In this wave model, the wave [iv] is completed. After its completion a downward wave [v] should be expected.
According to a lower-degree wave structure, Natural Gas is now moving within the ABC zigzag. In this case, the price is likely completing the formation of the wave (c).
Despite the positive dynamics of the market movement, the possibility of resuming the downward movement after the completion of the current wave shouldn’t be excluded.
In this situation, it should be emphasized that short positions remain preferable.
Alternative scenario
Long positions should be looked for after the breakout of the top of the current wave.
Natural Gas H1: Wave Analysis for the European Session on 13.2.2026