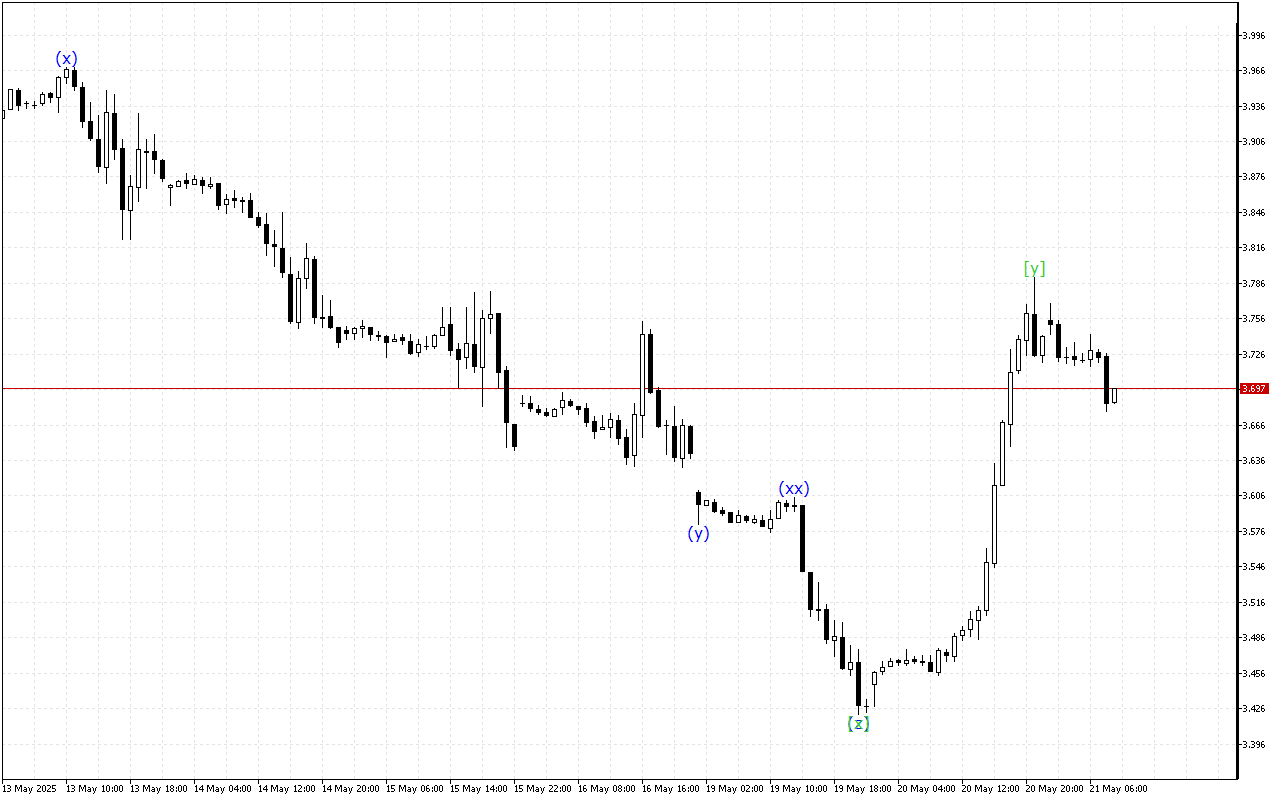
The Natural Gas chart maintains mixed trading dynamics, reflecting the lack of consensus between optimists and pessimists.
The wave structure of a higher-degree is a correctional area. Now the formation of the final wave [y] is seen. After its completion, the further direction of movement can be determined in the market or the development of a five-wave structure will be seen.
At a lower degree of the wave structure, the development of a triple three, where the formation of wave (z) has completed, is seen.
Analysis shows that the market dynamics are characterized by mixed signals over a longer distance. In such conditions, it is worth waiting for the current wave to complete its formation.
In the current situation, it’s wise to hold off on making any trading decisions.
Natural Gas H1: Wave Analysis for the European Session on 21.5.2025