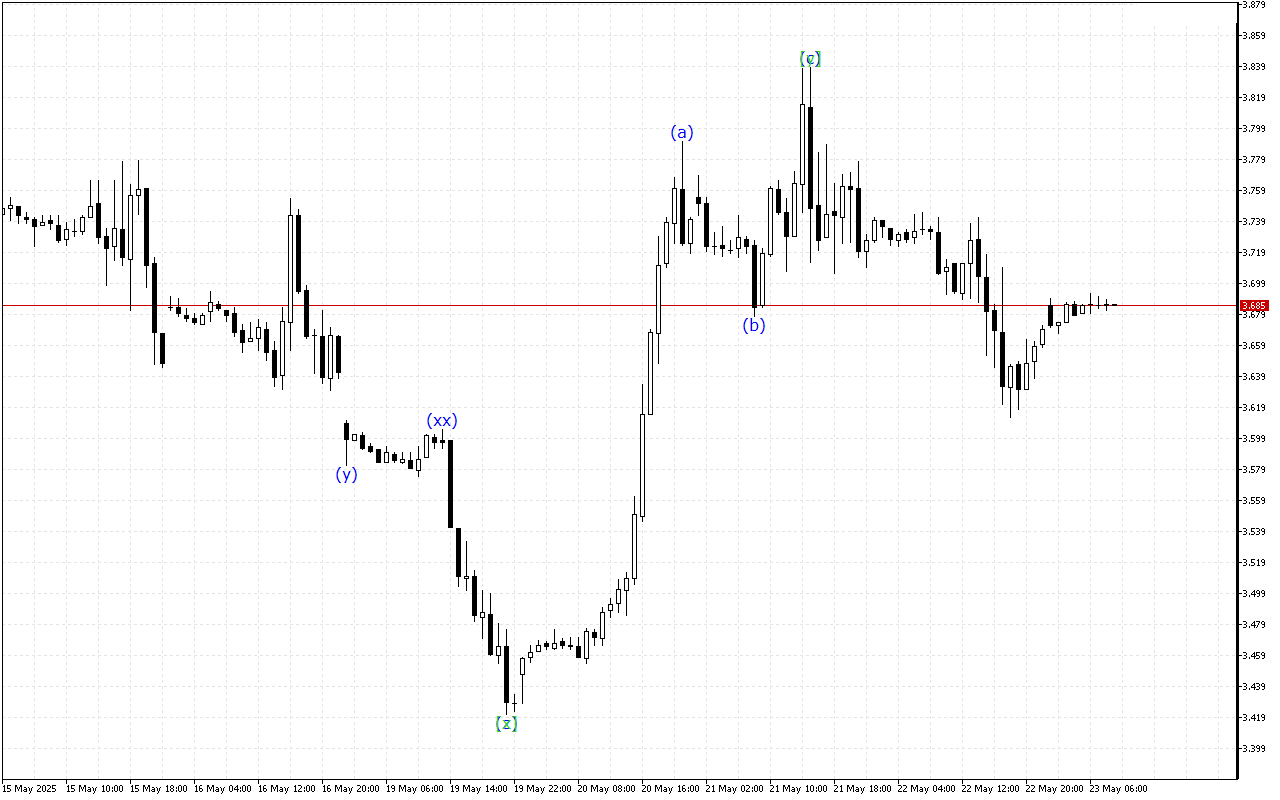
The Natural Gas chart shows mixed trading dynamics, with periods of both positive and negative price activity.
The wave structure indicates the formation of a WXY double three. The final wave [y] is currently being observed.
According to a lower-degree wave structure, Natural Gas is now moving within the ABC zigzag. In this case, the price is likely completing the formation of the wave (c).
To summarize, it can be noted that the market shows mixed dynamics over a longer period. In this situation, it is worth waiting for the current wave to complete its formation.
In the current environment, it’s advisable to avoid making significant trading moves.
Natural Gas H1: Wave Analysis for the European Session on 23.5.2025