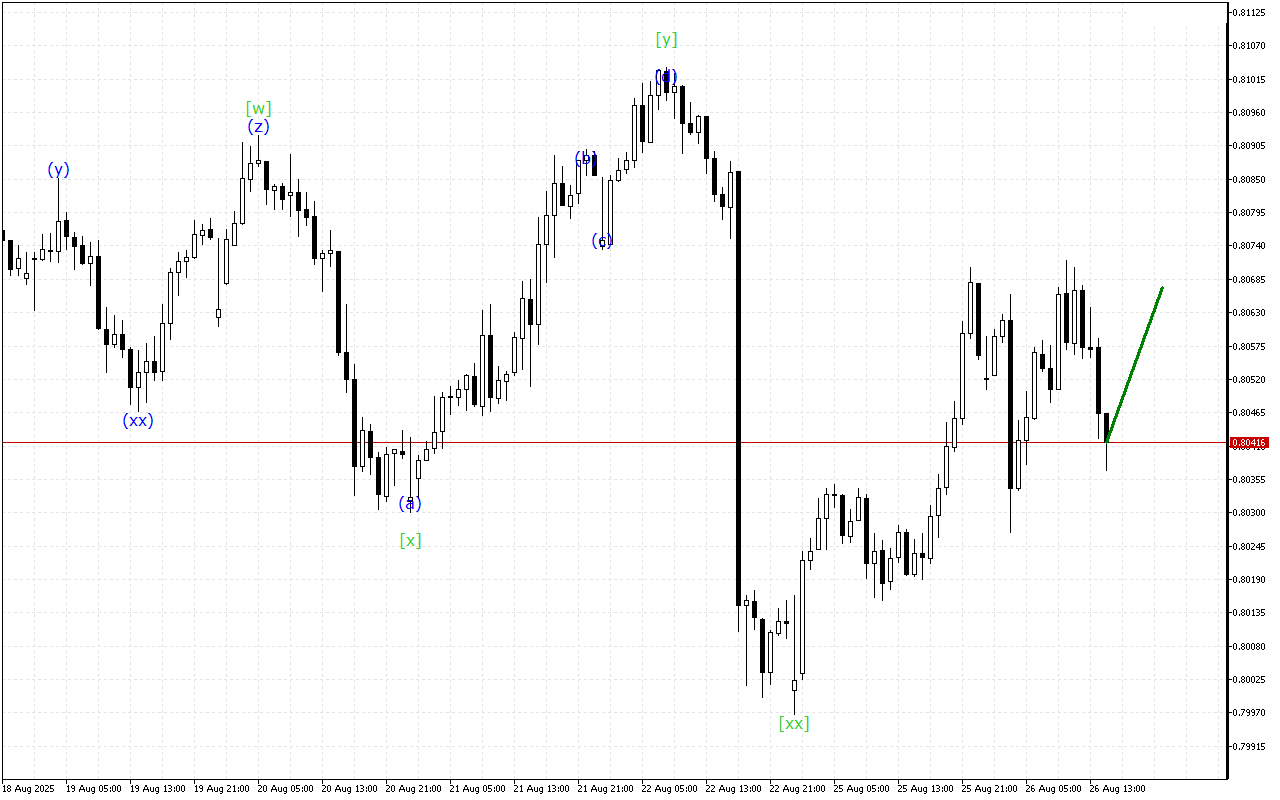
Despite the steady decline in price, the USDCHF chart is giving signals about a possible completion of the current bearish momentum.
The medium-term movement vector of USDCHF indicates the formation of a Triple Three wave structure. Now the formation of the wave [xx] is completed and the beginning of an upward movement within the wave [z] is expected.
According to a lower-degree wave structure, USDCHF is now moving within the ABC zigzag. In this case, the price is likely completing the formation of the wave (c).
To summarize, at the moment the USDCHF chart is maintaining a downward movement vector. However, the corrective wave is in the final stage of formation.
In this situation, long positions are prioritized.
USDCHF H1: Wave Analysis for the American Session on 26.8.2025