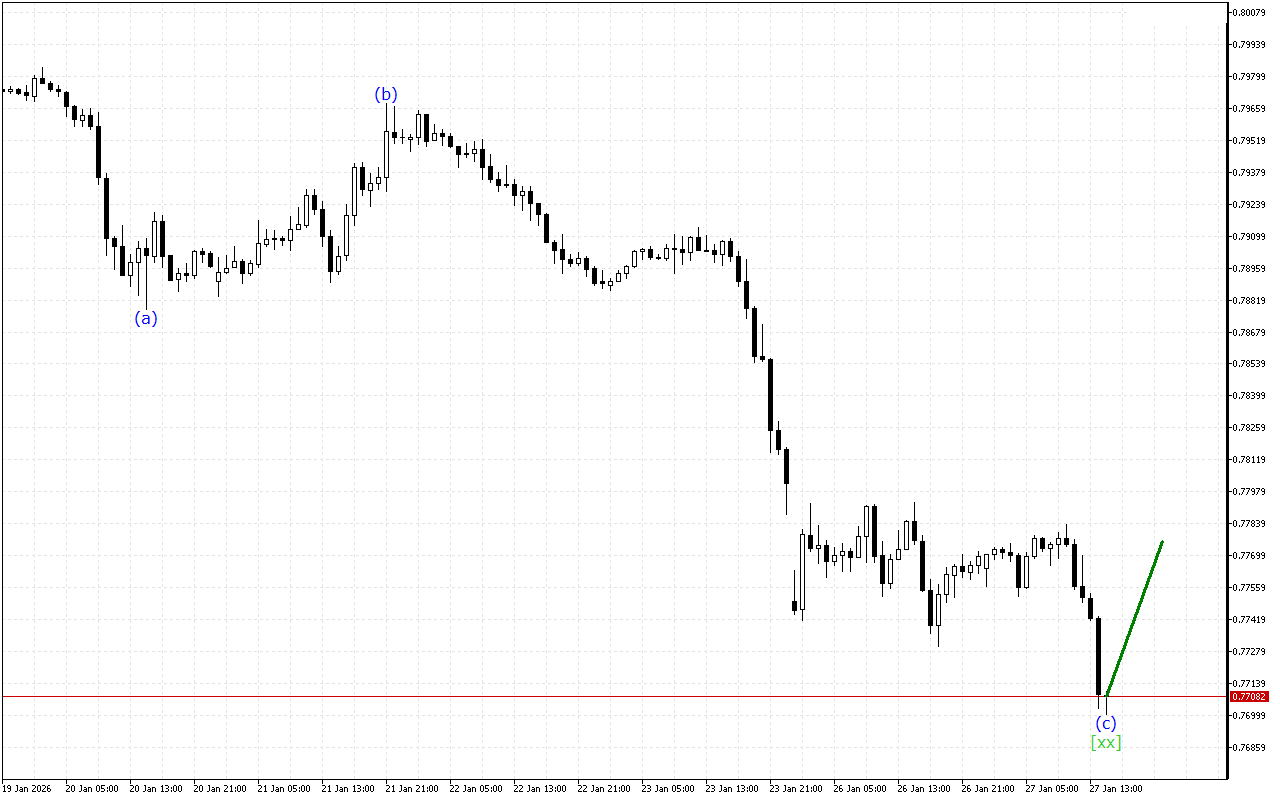
The market is still heading down, but the chart shows signs that the current trend will end soon.
The medium-term movement vector of USDCHF indicates the formation of a Triple Three wave structure. Now the formation of the wave [xx] is completed and the beginning of an upward movement within the wave [z] is expected.
According to a smaller time-frame, the market moves within the ABC zigzag. Currently, the price is completing the formation of the wave (c) apparently and the price movement may move into a new wave formation.
To summarize, at the moment the USDCHF chart is maintaining a downward movement vector. However, the corrective wave is in the final stage of formation.
In this situation, long positions are prioritized.
Alternative scenario
Short positions will be relevant after the breakout of the current wave start level
USDCHF H1: Wave Analysis for the American Session on 27.1.2026