Although the market maintains an upward momentum prevalence, the Natural Gas chart shows signs of a possible end to this trend.
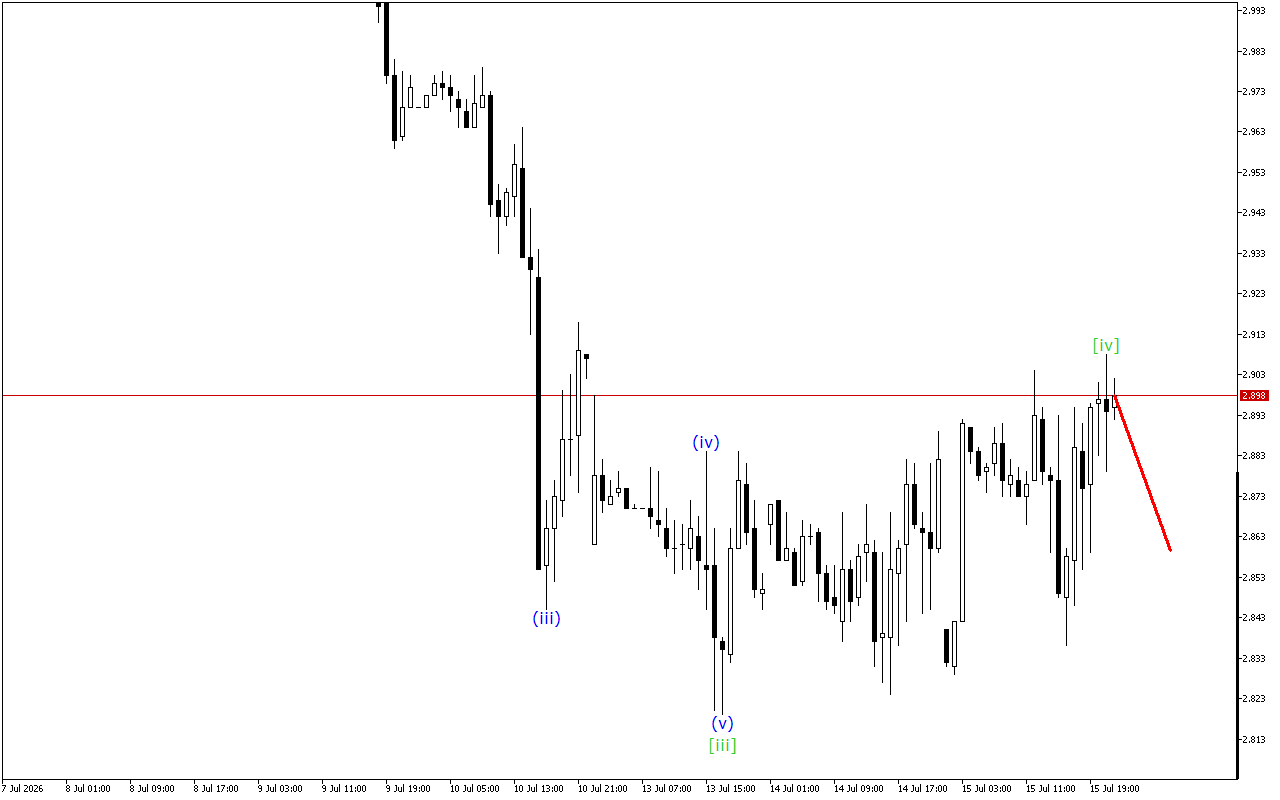
The analysis of the wave structure indicates the development of an incomplete downward impulse. Currently, a corrective wave [iv] has been formed, which is followed with the development of a downward wave [v].
According to the data of the smaller wave structure, the development of a downward impulse is observed. The price forms the last wave (v). After the completion of this wave, a corrective downward movement may begin.
Thus, an upward movement continues to form on the Natural Gas chart, but this impulse is at the final stage of formation so the price may resume a downward movement.
In this case, the emphasis is on short positions that can be considered at current levels.
Alternative scenario
Long positions should be looked for after the breakout of the top of the current wave.
Natural Gas H1: Wave Analysis for the Asian Session on 16.7.2026